Express, Inc. (EXPR) is a specialty apparel and accessory retailer offering both women's and men's merchandise. The Company operates in brick and mortar retail stores and the express.com e-commerce website.
I found this stock using a real-time custom scan. This one hunts for volume gainers on the day. I've included the details of the scan below.
Custom Scan Details
Stock Price GTE $5
IV30™ GTE 30
IV30™ Percent Change GTE 10
Average Option Volume GTE 1,200
IV30™ Change GTE 7
The goal with this scan is to identify names with rising IV30™ that also have a reasonable amount of liquidity in the options (thus the minimum average option volume) and enough strikes to spread and thus a minimum stock price. I also require a minimum volume level in order to avoid any boring ETFs (or whatever).
I also noted some substantial option volume relative to the average – a scan which EXPR also falls in as of yesterday. I’ve included the Stats Tab and Today’s Biggest Trades snaps below.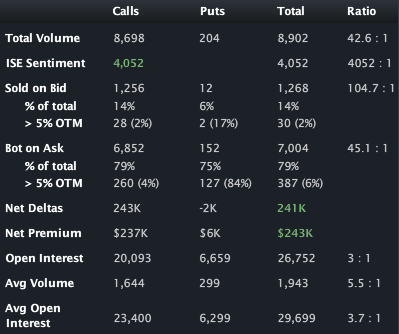
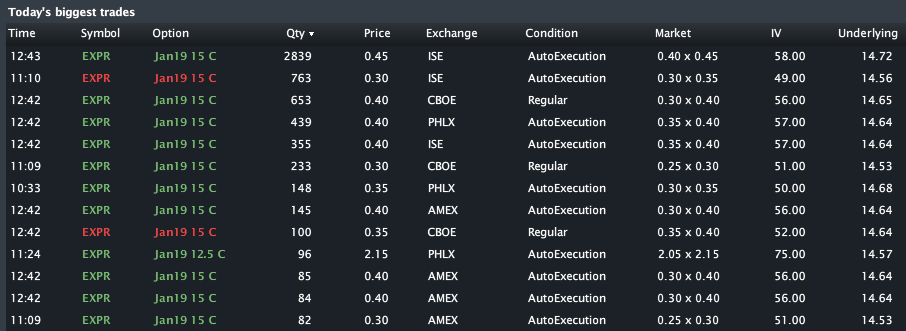
We can see that nearly 9,000 contracts have already traded on total daily average volume of just 1,943. Calls have traded on a 43:1 ratio to puts with the action almost entirely in the Jan 15 calls.
I also note that the total OI in EXPR as of yesterday is ~27,000, and that OI in the Jan 15 calls after yesterday may be ~13,000. So, the position that’s growing is non-trivial for this name.
Looking to the Options Tab, below, we can see a large OI already exists in those Jan 15 calls, although the trade volume yesterday is larger than that OI. The trades yesterday feel like purchases and that 12.6 vol point increase in Jan (across the very top of the Options Tab, below) is the circumstantial evidence to support the claim.
That existing OI was just 3,800 (ish) on 1-2-12, has been growing steadily over the last week, and appears to be long. So, in English, yesterday’s trades appear to be double-downs on the long side of those calls. Stock volume, on the other hand, is well below the daily average, so these seem to be naked call purchases… Very interesting. 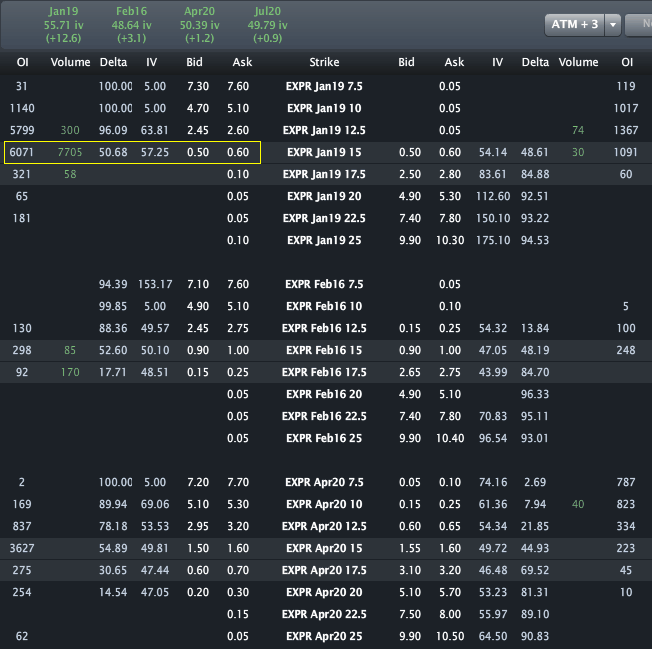
The EXPR one-year Charts Tab is included (below). The top portion is the stock price the bottom is the vol (IV30™ - red vs HV20™ - blue vs HV180™ - pink).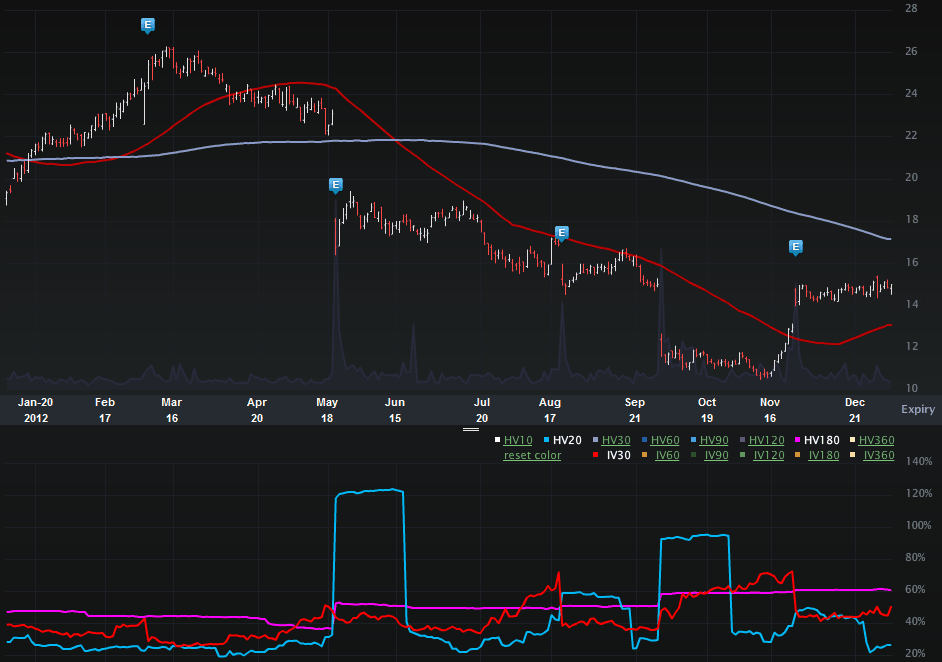
We can see how the stock has had a tendency to gap down, whether it be earnings related or not. It also has risen rather abruptly since mid Nov from the $11 (ish) range to now ~$15. The 52 wk range in stock price is [$10.47, $26.27].
I have included a very short-term 3-month IV30™ chart below.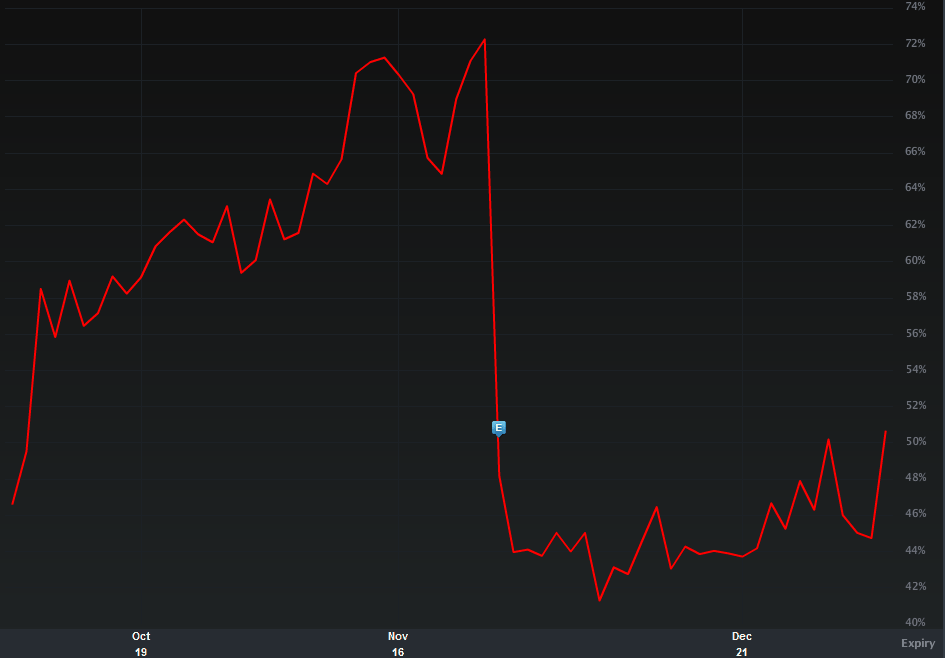
What I really wanted to focus on was both the massive vol drop off of earnings (which is normal), as well as the abrupt pop yesterday. The stock definitely in play in the options world (wrt to both volume and vol), though the equity market (stock price) isn’t doing a whole lot. The 52 wk range in IV30™ is [25.48%, 72.28%], putting the current level in the 53rd percentile (annual), or in English, right about in the middle.
I note the rising vol as well as the interest growing in the ATM calls – long interest. These seem to be substantial bets to the upside in the vey near-term. This will be an interesting one to keep an eye on.
Disclosure: This is trade analysis, not a recommendation.
Images provided by Livevol®
- English (UK)
- English (India)
- English (Canada)
- English (Australia)
- English (South Africa)
- English (Philippines)
- English (Nigeria)
- Deutsch
- Español (España)
- Español (México)
- Français
- Italiano
- Nederlands
- Português (Portugal)
- Polski
- Português (Brasil)
- Русский
- Türkçe
- العربية
- Ελληνικά
- Svenska
- Suomi
- עברית
- 日本語
- 한국어
- 简体中文
- 繁體中文
- Bahasa Indonesia
- Bahasa Melayu
- ไทย
- Tiếng Việt
- हिंदी
Express: Volume Pops, January ATM Calls Trading Size
Published 01/09/2013, 02:08 AM
Updated 07/09/2023, 06:31 AM
Express: Volume Pops, January ATM Calls Trading Size
Latest comments
Loading next article…
Install Our App
Risk Disclosure: Trading in financial instruments and/or cryptocurrencies involves high risks including the risk of losing some, or all, of your investment amount, and may not be suitable for all investors. Prices of cryptocurrencies are extremely volatile and may be affected by external factors such as financial, regulatory or political events. Trading on margin increases the financial risks.
Before deciding to trade in financial instrument or cryptocurrencies you should be fully informed of the risks and costs associated with trading the financial markets, carefully consider your investment objectives, level of experience, and risk appetite, and seek professional advice where needed.
Fusion Media would like to remind you that the data contained in this website is not necessarily real-time nor accurate. The data and prices on the website are not necessarily provided by any market or exchange, but may be provided by market makers, and so prices may not be accurate and may differ from the actual price at any given market, meaning prices are indicative and not appropriate for trading purposes. Fusion Media and any provider of the data contained in this website will not accept liability for any loss or damage as a result of your trading, or your reliance on the information contained within this website.
It is prohibited to use, store, reproduce, display, modify, transmit or distribute the data contained in this website without the explicit prior written permission of Fusion Media and/or the data provider. All intellectual property rights are reserved by the providers and/or the exchange providing the data contained in this website.
Fusion Media may be compensated by the advertisers that appear on the website, based on your interaction with the advertisements or advertisers.
© 2007-2024 - Fusion Media Limited. All Rights Reserved.
