Forex News and Events:
The EUR continues to lose ground against the USD as the ECB is expected to ease policy in June while the Fed will finalize asset buying by October. Globally bond yields are breaking lower (after a sharp drop by US treasuries) yet equity markets are holding up well. Looking forward the key event will be the European central bank policy meeting. Measuring ECB speak it seems that Draghi is preparing for some type of policy action, however risk of disappointment is high. The highest probability event is for a 10bp-15bp rate cut (in depo and refi) which seems to be fully priced by the market. We also view the adding of measures to encourage extension of credit aimed at banks (FLS/LTRO) a significant possibility, and would provide a small surprise. But the announcement that would illustrate that the ECB is ready to take critical steps to stave-off deflation with large-scale American style asset purchases looks unlikely (estimates of size starts at €1trn). So a mild cut in rates plus measure to support short ended liquidity is the high probability results and is unlikely to impress the market.
The lack of innovation and commitment by the ECB is likely to lead to a cutting of EUR shorts in the near term. EUR strengthens particularly due to the widening between the ECB and Fed balance sheets. The ECB balance sheet has been contracting due to LTRO repayments, while the Fed continues to buy bonds. There is a real apprehension within the ECB for balance sheet expansion, so while adjusting interest rates might have a minor effect, unless Europe unchains QE there will be limited impact on Euro strength.

Today's Key Issues (time in GMT):
2014-05-29T12:30:00 CAD 1Q Current Account Balance, exp -$13.0B, last -$16.0B2014-05-29T12:30:00 CAD Mar Average Weekly Earnings YoY, last 2.30%
2014-05-29T12:30:00 USD 1Q S GDP Annualized QoQ, exp -0.50%, last 0.10%
2014-05-29T12:30:00 USD 1Q S Personal Consumption, exp 3.10%, last 3.00%
2014-05-29T12:30:00 USD 1Q S GDP Price Index, exp 1.30%, last 1.30%
2014-05-29T12:30:00 USD 1Q S Core PCE QoQ, exp 1.30%, last 1.30%
2014-05-29T12:30:00 USD 24.mai Initial Jobless Claims, exp 318K, last 326K
2014-05-29T12:30:00 USD 17.mai Continuing Claims, exp 2650K, last 2653K
2014-05-29T14:00:00 USD Apr Pending Home Sales MoM, exp 1.00%, last 3.40%
2014-05-29T14:00:00 USD Apr Pending Home Sales YoY, exp -8.80%, last -7.40%
The Risk Today:
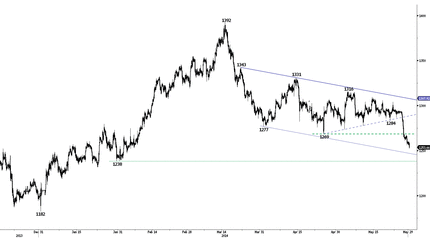
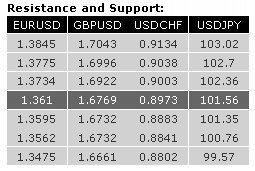
EUR/USD has moved decisively below the short-term support at 1.3616 (23/05/2014 low), confirming the recent technical deterioration. The short-term technical structure calls for further weakness as long as prices remain below the resistance at 1.3688 (intraday high). Another resistance lies at 1.3734 (19/05/2014 high). A support stands at 1.3562 (12/02/2014 low). In the longer term, the break of the long-term rising wedge (see also the support at 1.3673) indicates a clear deterioration of the technical structure. The downside risk implied by the double-top formation is 1.3379. Key supports can be found at 1.3477 (03/02/2014 low) and 1.3296 (07/11/2013 low).
GBP/USD has broken its long-term rising channel, confirming a larger corrective phase. Hourly resistances can be found at 1.6783 (27/05/2014 low) and 1.6882 (27/05/2014 high, see also the declining channel). Monitor the key support at 1.6661. In the longer term, despite the break of the long-term rising channel, the lack of significant bearish reversal pattern suggests a limited downside risk. Indeed, the current weakness is looking like a classic "zig-zag" (or A-B-C) correction. As a result, a medium-term bullish bias remains favoured as long as the support at 1.6661 (15/04/2014 low) holds. A major resistance stands at 1.7043 (05/08/2009 high).
USD/JPY has successfully tested the strong support at 100.76. However, a break of the resistance area between 102.14 (see also the declining trendline) and 102.36 (13/05/2014 high) is needed to suggest something more than a short-term bounce. An hourly support can be found at 101.35. A long-term bullish bias is favoured as long as the key support 99.57 (19/11/2013 low) holds. Monitor the support area provided by the 200 day moving average (around 101.39) and 100.76 (04/02/2014 low). A major resistance stands at 110.66 (15/08/2008 high).
USD/CHF has broken the key resistance at 0.8953, confirming a persistent buying interest. A short-term bullish bias is favoured as long as the support at 0.8924 (22/05/2014 low) holds. Another support stands at 0.8883 (15/05/2014 low). Resistances can be found at 0.9038 (12/02/2014 high) and 0.9082 (03/02/2014 high). From a longer term perspective, the bullish breakout of the key resistance at 0.8953 suggests the end of the large corrective phase that started in July 2012. The upside potential implied by the double-bottom formation is 0.9207. A key resistance stands at 0.9156 (21/01/2014 high).

