Gold bulls received a setback earlier this month when price poked beneath an important support level. Despite this, we believe gold prices should bounce soon. It's even possible they could reach new highs later this year or in 2022, although that is not our preferred scenario.
Using charts of the SPDR Gold Shares (NYSE:GLD) ETF, to illustrate, we cannot rule out the possibility that price is climbing impulsively from its late 2015 low. Certainly that's what gold bulls would like to see. However we believe it more likely that a price climb from nearby supports will draw bullish traders into the market before putting in a downward reversal from a lower high.
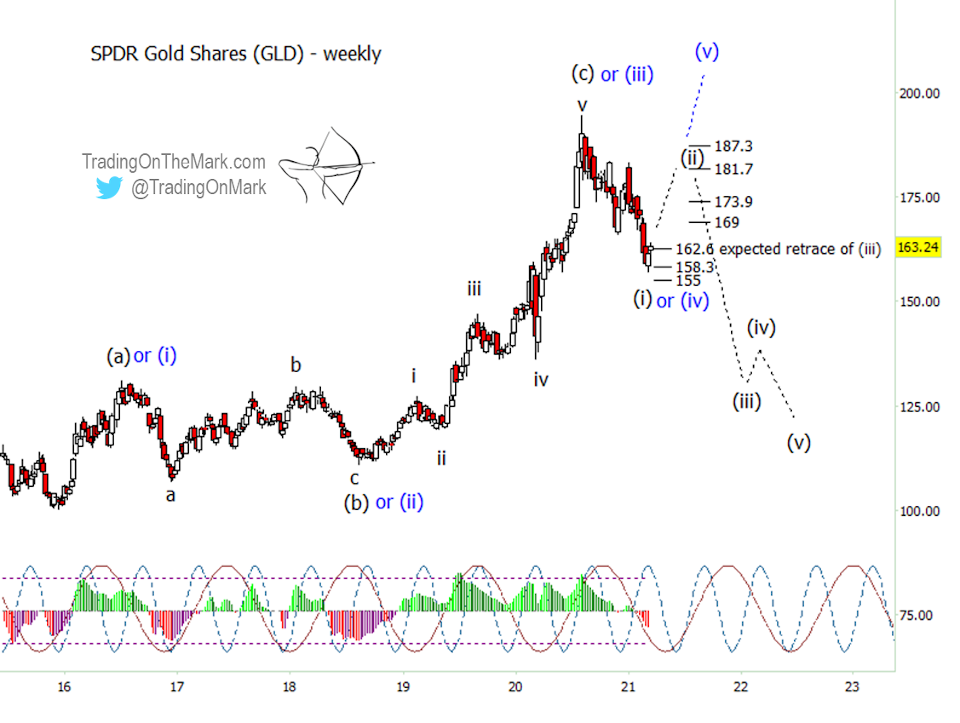
The weekly chart below shows both scenarios. Regardless of your long-term view, each scenario allows for a tradable bounce from nearby.
Gold bulls would like the late 2015 low to serve as a durable base for prices to climb ever upward. Gold bulls who also pay attention to Elliott wave analysis would like to treat the climb from 2015 as part of a five-wave move upward, with waves (i), (ii) and (iii) finishing in 2016, 2018 and 2020, respectively. We have labeled that wave count in blue on the chart.

The setback for bulls came when price failed to find initial support at what should be the 38.2% Fibonacci retracement level of wave (iii), which we have marked at 162.6 on the chart. That's a standard area for a fourth wave to find support, but the level was barely recognized in real time.
Despite what we're calling a setback for bulls, price can still find support near its current area. There's a type of Fibonacci level at 158.3 based on the internal structure of the downward move from the high, and there's another Gann-related support at 155.0. The higher of those levels already shows some recognition by the market.
If support kicks in soon, as we expect, the question will be whether the bounce is a continuation of the upward move that's labeled in blue or is instead the start of a new downward pattern segment we have labeled in black. We prefer the second scenario, which makes us gold bears going into 2022 or 2023.

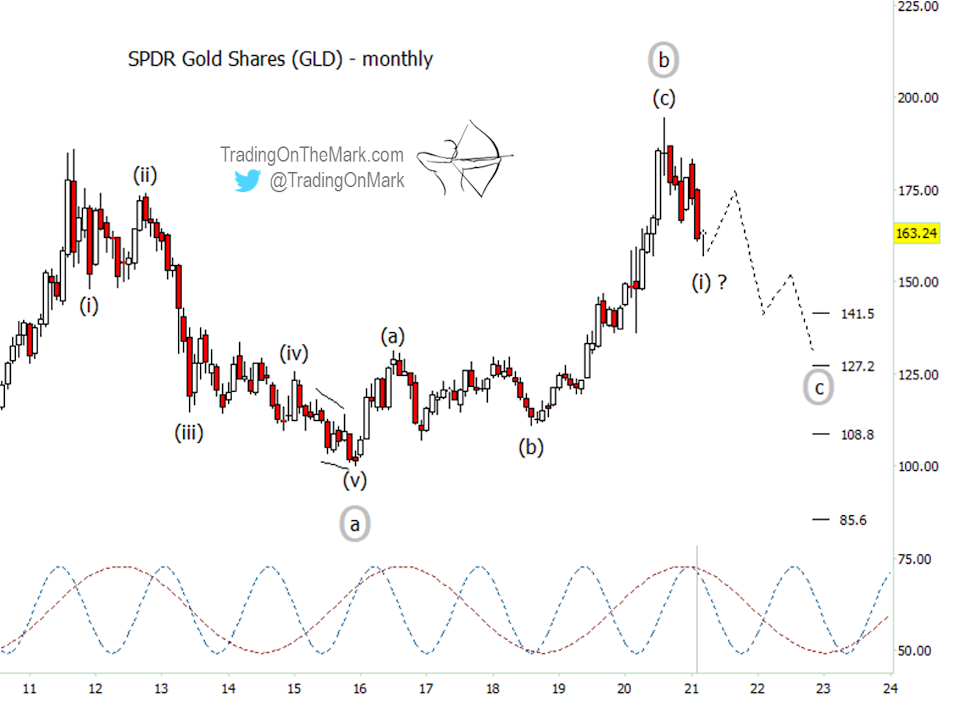
The internal structure of the decline from the 2020 high is not easy to count. It's not obviously impulsive, but it also isn't unambiguously corrective. We are provisionally treating the decline as downward wave (i) of larger downward wave circle-C, as shown on the monthly chart above. That would allow the entirety of price action since the 2011 high to be an [a]-[b]-[c] corrective pattern, and it would lead to a tremendous buying opportunity a few years hence.
