Get 40% Off
🚀 AI-picked stocks soar in May. PRFT is +55%—in just 16 days! Don’t miss June’s top picks.Unlock full list

Every Picture Tells A Story: Dow Jones Futures

Published 03/08/2020, 12:05 AM
Updated 07/09/2023, 06:31 AM
DJI
-
1YMM24
-

YM Daily Chart

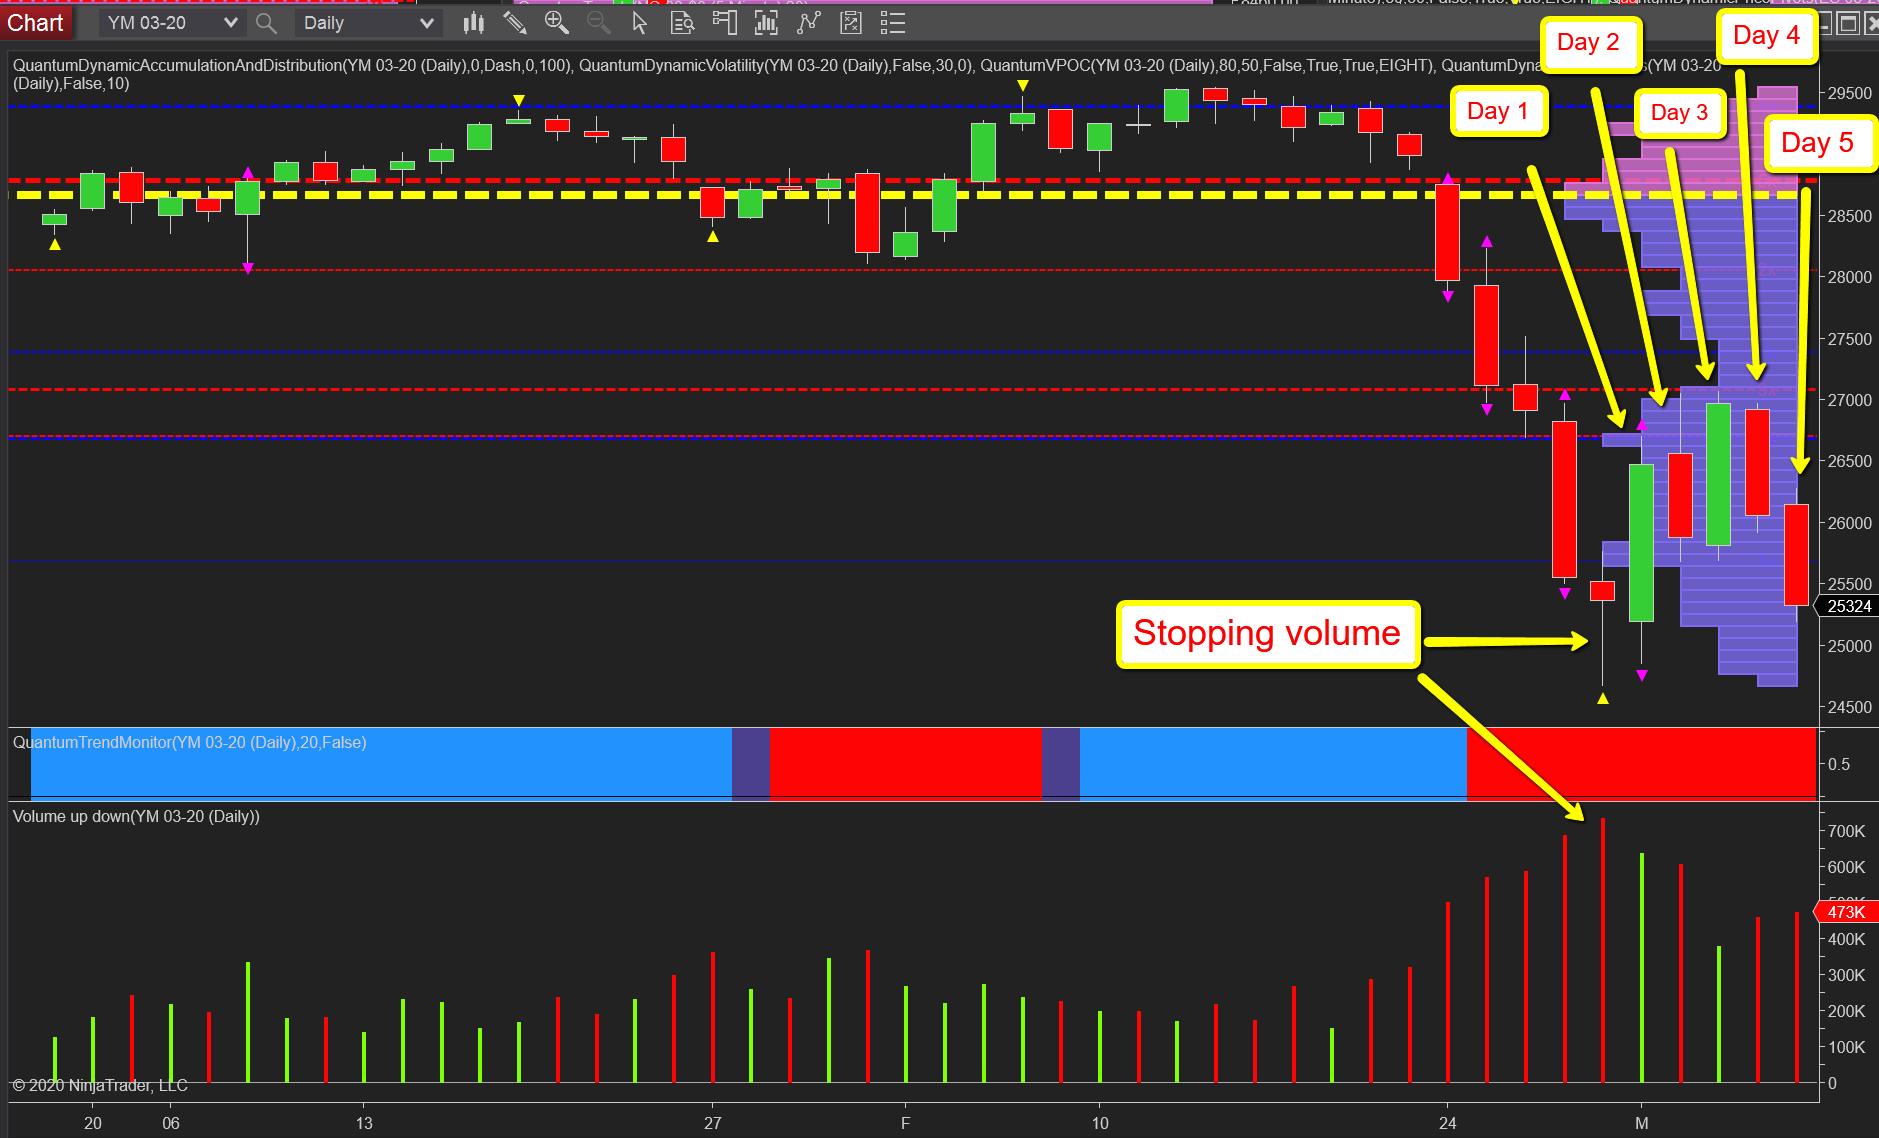
Every picture tells a story and the same truism could be applied to any of the daily charts for US markets as we come to the end of another dramatic week, and in this case, I’ve settled on the YM Emini for March, the futures contract for the Dow Jones Industrial Average.

If we start with this time last week, the deep hammer candle on extreme volume signaled the first appearance of stopping volume, with the prospect of a recovery in due course. In such volatile times, it was no surprise to see this appear the next trading day, Monday of this week, with a dramatic recovery on excellent supporting volume, but one which triggered the volatility indicator, and therefore the prospect of congestion developing. Day 1 of five over. Day two signaled weakness as the recovery failed to follow through with a high volume down day following. Day three followed with another surge higher, but the associated volume was average and well below what we should expect for such a sustained rally. A trap was laid and sprung on day four with the indices selling off strongly on good volume, a move repeated today on day 5 with marginally higher volume. As an aside, overlay days 3 and 4 and we have a two-bar upthrust.

So, what can we expect next week? In simple terms, more of the same and in much the same price range, and as I outlined in my post last week when a market is being crushed in this way, it takes more than one day of stopping volume to absorb all the mountain of selling pressure. Think of it like a sponge mopping up a spill. It takes several attempts. It’s the same here and as such, more plunging price action to clear the selling pressure from the market. Comparing the current volumes with those of last week, the weight of selling is already starting to decline, but it will take further panic selling to clear it completely, before volume subsides, congestion follows, and the reversal begins with a low volume test.

Latest comments

Loading next article…
Risk Disclosure: Trading in financial instruments and/or cryptocurrencies involves high risks including the risk of losing some, or all, of your investment amount, and may not be suitable for all investors. Prices of cryptocurrencies are extremely volatile and may be affected by external factors such as financial, regulatory or political events. Trading on margin increases the financial risks.
Before deciding to trade in financial instrument or cryptocurrencies you should be fully informed of the risks and costs associated with trading the financial markets, carefully consider your investment objectives, level of experience, and risk appetite, and seek professional advice where needed.
Fusion Media would like to remind you that the data contained in this website is not necessarily real-time nor accurate. The data and prices on the website are not necessarily provided by any market or exchange, but may be provided by market makers, and so prices may not be accurate and may differ from the actual price at any given market, meaning prices are indicative and not appropriate for trading purposes. Fusion Media and any provider of the data contained in this website will not accept liability for any loss or damage as a result of your trading, or your reliance on the information contained within this website.
It is prohibited to use, store, reproduce, display, modify, transmit or distribute the data contained in this website without the explicit prior written permission of Fusion Media and/or the data provider. All intellectual property rights are reserved by the providers and/or the exchange providing the data contained in this website.
Fusion Media may be compensated by the advertisers that appear on the website, based on your interaction with the advertisements or advertisers.
© 2007-2024 - Fusion Media Limited. All Rights Reserved.