- Dollar strength concerns markets
- Currency moves is doing the Fed’s work
- Euro demand for U.S assets intensifies
- China needs further policy support
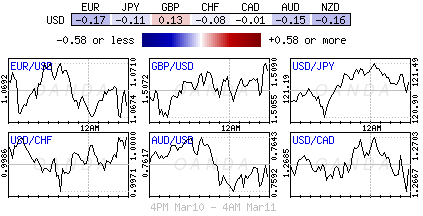
The global rate differentials argument continues to have the USD racking up fresh multi-year highs against its peers. It’s the same Capital Market story, just a different day, and in some cases a different currency handle. Currently for investors, it’s difficult to take your eye off the ball; if you blink you may have just missed another big handle move in the EUR, lost out on any year-to-date gains in U.S equities, or be sideswiped by the flatness of varying yield curves.
The market is concerned that the combination of a stronger dollar and tepid global growth could provide unwarranted problems for the U.S. economy. GDP queries have U.S equities seeing red. So far this week, both the Dow and S&P 500 have managed to wipe out all their 2015 advances. Even commodity dealers are being swayed by the mighty buck’s direction and not fundamentals. Precious metal prices are sinking as investors continue to price in a near term Fed rate hike.

U.S Treasuries look attractive
For the fixed income market, it’s worried that a rampant dollar will do the Fed’s job for them. Is there a need for U.S policy makers to be in a hurry to hike rates any time soon? U.S yields are not rallying as would be expected in this environment. Why? Very simply, the ECB’s QE bond buying program, launched on Monday, is making U.S Treasuries look attractive.
No one wants to invest in ‘negative’ yields. Much of short-term euro debt has investors paying away the privilege to own product. Currently for portfolio managers, any return is a good return. The German 10-Year bund has fallen below +0.20% while German yields are negative all the way out to Sept 2022 issuance.
Record lows are also being exhibited in Ireland, Spain, Italy, Netherlands, Belgium, Austria and France. For U.S policy makers, perhaps a strong dollar allows them to be “patient.” Ms. Yellen and company will have the opportunity to enlighten Capital Markets on their position as early as next week. Whether they do, is the million-dollar question.

Market is front running Draghi’s program
This is not a busy week for Capital Markets on the fundamental front, in fact its rather dull. Markets volatility is being driven by the ECB’s QE program.
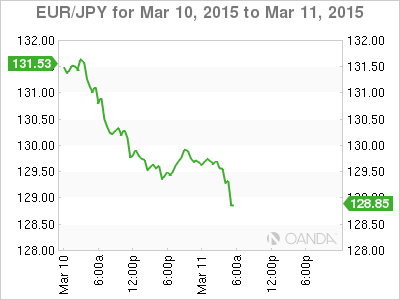
It appears that the market is in desperate need to front run Draghi’s bond-buying program as the fear of collateral scarcity unfolds quicker than expected. The speed at which longer term euro yields are being driven towards zero is helping to pick up the pace of the EUR’s decline.
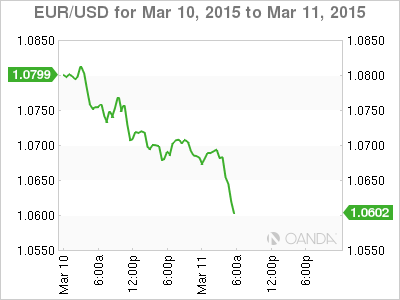
Presently, the EUR is poised for its biggest quarterly decline. The shared currency has managed to weaken about -11.6% outright this year, slumping to another 12-year low this morning (€1.0600). The fact that the EUR is falling for a legitimate fundamental reason, and has the full support of the ECB, there is no reason why further heavy losses cannot continue.
The large divergence in the monetary stance of the Fed and the ECB will not be changing anytime soon. Nor will the fact that negative interest rates are forcing a wave of cash out of the eurozone, depressing the single currency even further. The size of the ECB’s QE program (about half the size of the U.S and U.K) was never going to “inflate” deflation alone. The ECB needs a much weaker EUR and they are getting it as eurozone domestic investors look abroad for higher returns and higher yields.

China Data Reinforces loose Policy
Investors have mostly been preoccupied with Europe at the moment. Soon they will have to begin focusing on China with a bit more urgency as data there continues to reveal that the world’s second largest economy is slowing down.
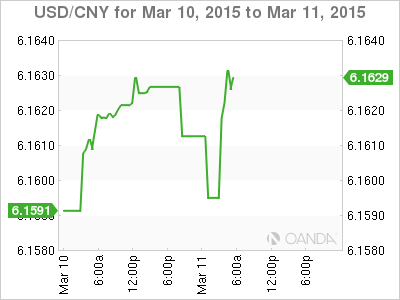
In the overnight session, industrial production growth fell sharply to +6.8% in January and February, down from +7.9% in December, and well below market consensus (+7.7%). Retail sales growth slowed too, to +10.7% from +11.9% in December. The softer reports would suggest that China’s economy is still losing and needs further policy support in the form of interest cuts and other monetary policy loosening.
The PBoC has singled out the rise of “real” interest rates on the back of cooling inflation as a further drag on the economy, especially as many companies are struggling with heavy debt levels and end-user demand remains weak.
The last rate cut, a few weeks ago, did take the market by surprise, but they were not flat footed. Nevertheless, investors did pose the question was this the beginning of a new rate cycle cut? Present data would indicate the strong possibility.

