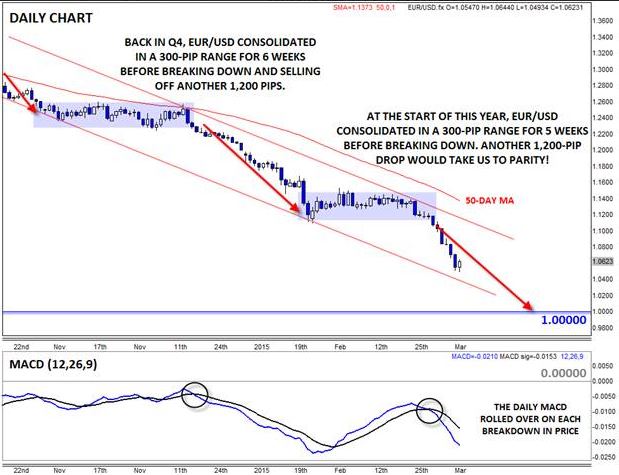
On a technical basis, there is no doubt that the bears have the upper hand in EUR/USD. The pair has consistently put in lower lows and lower highs since peaking at 1.40 back in May of last year, and any momentary pauses in the pair have eventually resolved to the downside, most recently in November/December and in February. In fact, the Q4 pause may provide a useful template for where EUR/USD could head next.
Back in Q4 of last year, EUR/USD:
1) Had fallen over 1,000 pips in three months to a new multi-year low.
2) Before stabilizing in the 300-pip range between 1.23 and 1.26 for over six weeks.
3) Then dropped through support at the bottom of the range.
4) Was accompanied by a turn lower in the MACD indicator.
5) Continued to sell off for nearly 1,200 pips before finding a modicum of support near 1.1200.
Interestingly, EUR/USD’s movement over the last two months has closely mirrored Q4’s price action.
As of the start of February, EUR/USD:
1) Had fallen over 1,000 pips in three months to a new multi-year low.
2) Before stabilizing in the 300-pip range between 1.12 and 1.15 for five weeks.
3) Then dropped through support at the bottom of the range.
4) Accompanied by a turn lower in the MACD indicator.
5) Then proceeded to sell off about 700 pips to a low of 1.05 thus far.
If we do see EUR/USD’s current sell-off match the 1,200 pip drop through late-December and January, it would take rates almost perfectly down to key psychological support at parity before finding support.
Of course, this type of technical analysis (fractals) is not infallible, and there is also another support level to watch between here and parity. Using an average of the original pre-euro European currencies, the synthetic “euro” found significant support at 1.0400 both in June 1989 and August 1997, leading to multi-year rallies. With desperate bulls looking for any level to make a stand, that historical precedent could provide a possible rallying point.
There is an important fundamental difference between the situation now and in Q4 as well. Unlike last time, bears cannot reasonably pin their hopes on the announcement of a massive new easing program by the European Central Bank; after all, the central bank has already instituted its QE program and shows no signs of expanding it further in the near term, though fears of a potential Grexit scenario could provide a similar bearish catalyst as we move into Q2.
Interestingly, the market’s positioning is no more extreme than it was in Q4: according to the latest CFTC Commitment of Trader data, futures speculators are net short EUR/USD to the tune of 224,000 contracts, essentially unchanged from 215,000-contact short positions when EUR/USD broke its last consolidation range back in December. The lack of truly extremely bearish sentiment (we reached a peak of 252k net short in early February) suggests that EUR/USD could continue to fall before reaching a capitulation bottom.
If Parity Breaks, Where Could EUR/USD Head Next?
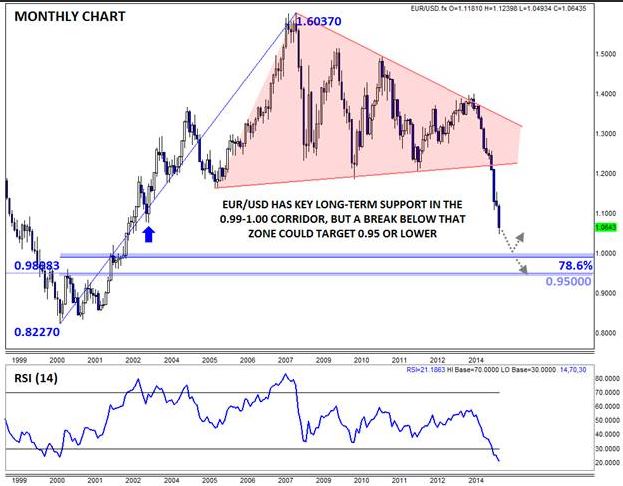
If Europe’s economic blight metastasizes, it’s conceivable that EUR/USD could drop below parity for the first time since 2002. In order to prepare for that possibility, we have to zoom all the way out to a monthly chart. Beyond psychological support at 1.00, the 78.6% Fibonacci retracement of the entire 2000-2008 rally comes in at 0.9900, strengthening the likelihood of support emerging in the 0.9900-1.0000 corridor. On the other hand, if EUR/USD manages to break through 0.9900 later this year, there is no compelling case for technical support to emerge until minor previous-resistance-turned support around 0.9500.
Any way you slice it, EUR/USD parity will be a massive long-term technical level to watch as we move through this year.


