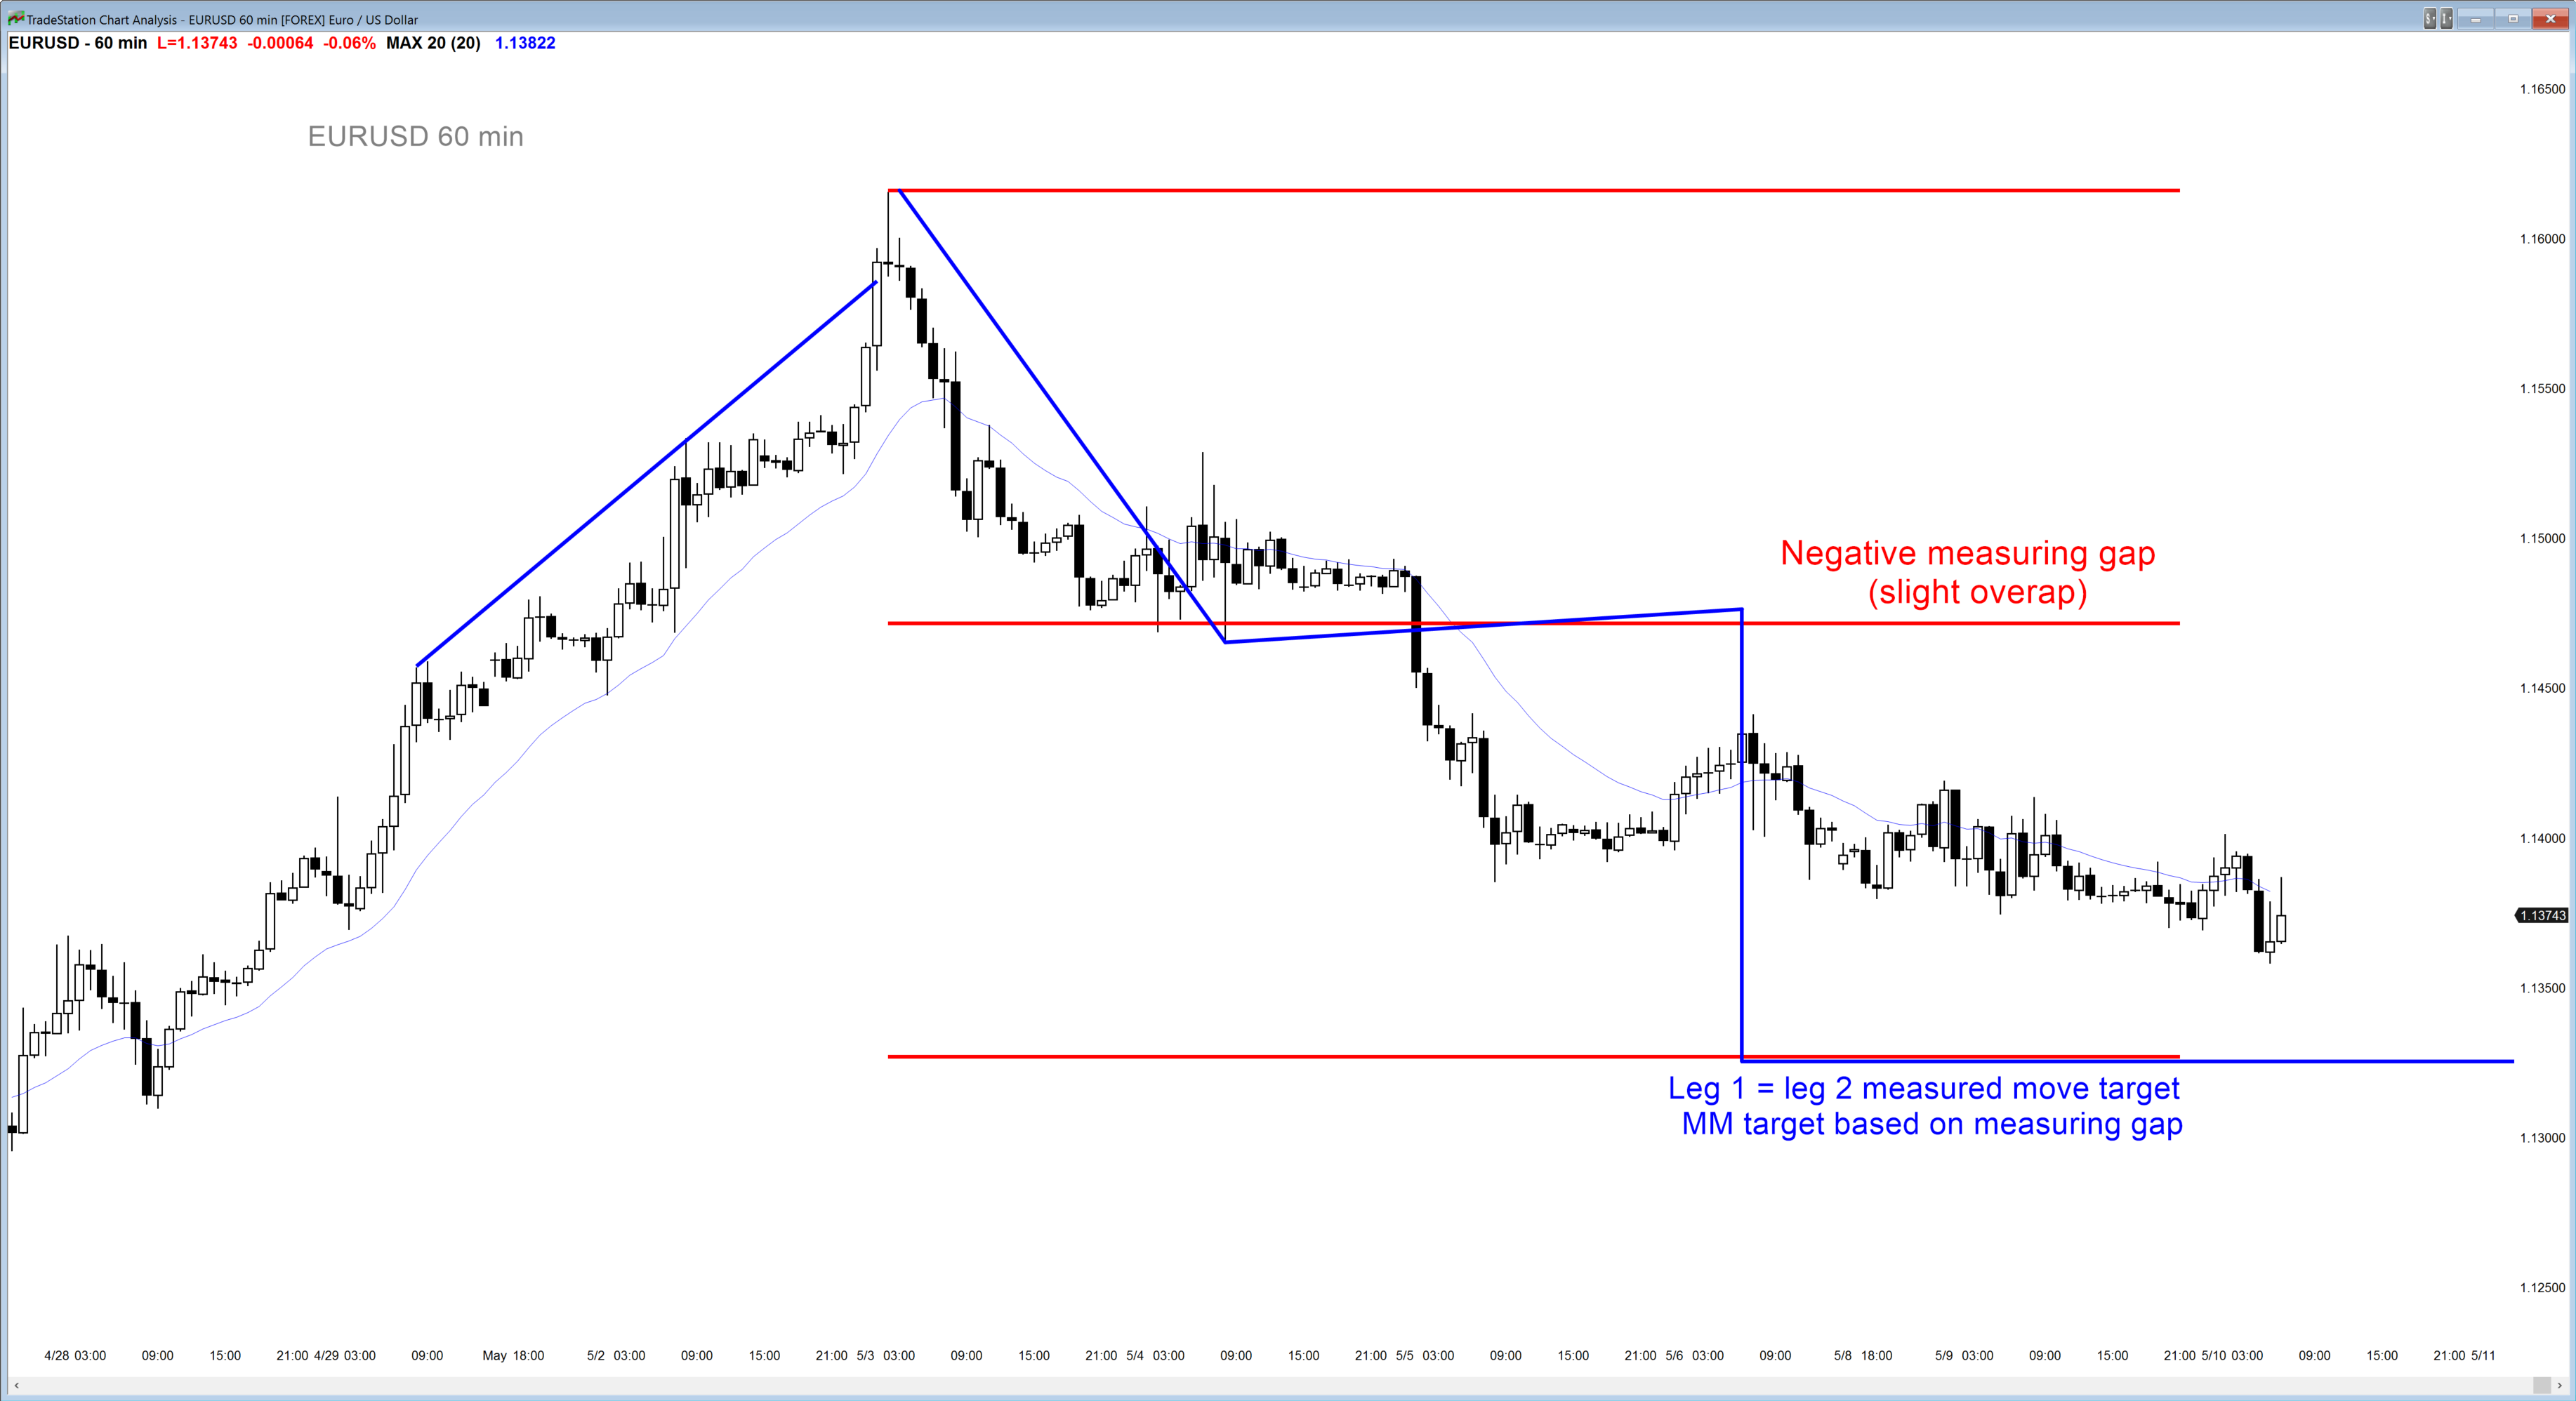
The 60 minute has measured move projections not far below. There might be buyers there.
The weekly chart of the EUR/USD has a wedge top, which will probably be followed by a could legs down. Last week was the sell signal bar and this week is the sell entry bar. The bears was a big bear bar closing on its low. There is still a lot of time left in the week, and the bears might still get a strong sell entry bar, but there is no sign of it yet.
The EUR/USD had doji candlestick patterns yesterday and the day before. The two day buy climax of April 29 and May 2 is important because many bulls put stops below the bottom of those 2 bars. This means that the April 29 low of 1.1344 is a magnet. It probably will be hit this week, although a test up could begin at any point, without 1st hitting support.
That buy climax was followed by a strong bear reversal bar last week. This created a Big Up, Big Down candlestick pattern. The bulls and bears are confused and lack conviction, and the result is usually a trading range. Neither believes the market will move very far over the next couple of weeks so they both will buy low, sell high, and scalp, which creates a trading range.
The 1st reversal up will probably be sold, creating a lower high. The selloff will probably find support around the bottom of the 1st leg down. That bottom is currently yesterday’s low, but it may fall a little further before there is a rally to a lower high.
The trading range often contains both a double top (the May 3 bull swing high and the rally that will probably begin this week) and a double bottom. The double bottom will be formed by the low of the current leg down, and the low that follows the selloff from the likely rally over that will probably begin in the next few days.
With the double top and double bottom, the EUR/USD chart will be in breakout mode. The probability of a successful bull breakout will be about the same as a successful bear breakout.
The EUR/USD Forex market has had a moderately strong 2-day rally from a double bottom on the daily chart. Friday was the buy signal bar, and it was a small bear doji. That is a low probability bottom, even though it was a double bottom with the March 29 low. The selloff of April 28 and 29 was stronger that the reversal up that began yesterday. This increases the chances that this rally will end today or tomorrow and test back down. When there are both reasonable buy and sell signals on different time frames, traders tend to take profits soon. This usually results in a trading range. which is likely to begin today or tomorrow.
The sell off from the May 3 high on the 60-minute chart has been in a tight channel. It also has had 2 legs down and it around a measured move down. It is also close to the magnet of the April 29 low, That day was a buy climax. The low of a buy climax is a magnet when the buy climax is big and comes 20 or more bars in a bull trend.
The EUR/USD has also had 6 days down and it is around a 50% pullback from the April 25 rally. The bear bars are not very big. The odds are that there will be a bounce here or soon. After a buy climax, 6 days down, and a weekly sell signal, the odds are that the 1st reversal up over the next few days will be sold and a trading range will begin to form. Although the 5-minute chart has been in a 40-pip trading range over night, most of the trading was in a 30-pip range. Most day traders will scalp for 10 pips until there is a strong breakout up or down.
