Most people watch the FTSE 100, the leading index in the UK, and the German DAX. The former was the first major index in Europe to make a new all-time high as investors rewarded it for Brexit instead of punishing it, counter to expectations. The latter is finally within spitting distance of making a new high. It just needs to rally another 3%.
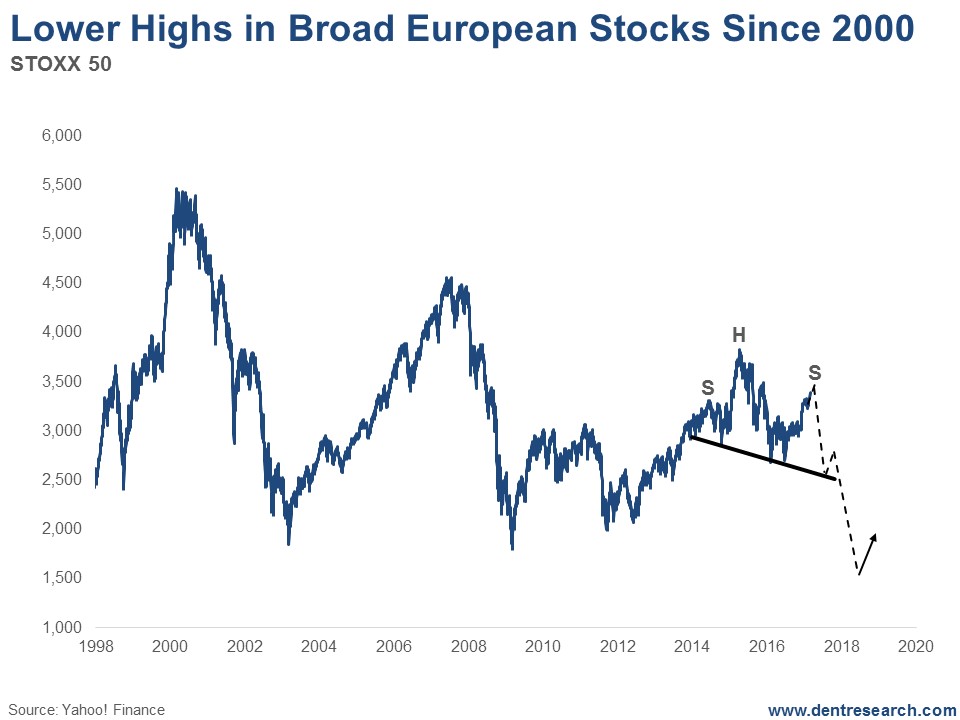
The problem is, the UK and Germany are not Europe. They’re not even representative of the situation on the continent. Just look at this chart, of the Stoxx 50. Think of it as the Dow of Europe. It holds very large-cap stocks across the Eurozone.
Does this tell a different story or what?

The Euro Stoxx 50 didn’t top in 2007. It peaked way back in early 2000, at 5,500. Then it crashed 64% into early 2003 and only made it back to 4,500 in 2007. Then it crashed 62% into early 2009. The rally since then has been even weaker, hitting just over 3,800 in early 2015. Now it sits at just a little more than 3,400, 38% below its 2000 high. There’s slim chance it’s going to hit a new all-time high anytime soon.
There’s something else on that chart I want you to pay attention to. See the “S”, “H”, and “S” I’ve marked? That’s a potential head-and-shoulders pattern that suggests the next crash will take the index to around 1,400 in the next year or so. That’s 75% off its all-time high in 2000!
So, what’s pulling down this index?
France and southern Europe.
Greece is still bankrupt. And it faces yet another default deadline in July.
Portugal has struggled ever since the euro crisis in 2011.
Spain’s economy is growing a bit faster due to stronger demographics, but its unemployment numbers and real estate market are still in the dumps.
Italian banks have 18% non-performing loans, which comprise a third of all the bad loans in the Eurozone. Italy is the next major country to threaten to and/or default. Its FTSE MIB market peaked in 2007 at 45,000 and then crashed 75%. Its rally only took it back to 25,000 in 2015. Now it’s near 20,000, 60% off its all-time high.
Then there’s France.
It’s increasingly a cause for concern, what with its far-right candidate, Marine Le Pen, pushing strongly for Frexit. She’s not likely to win, but she’s progressing and 34% of the French are against the euro compared to the 46% who are for it. Sixteen percent are undecided. (That said, very few expected Trump to win either.)
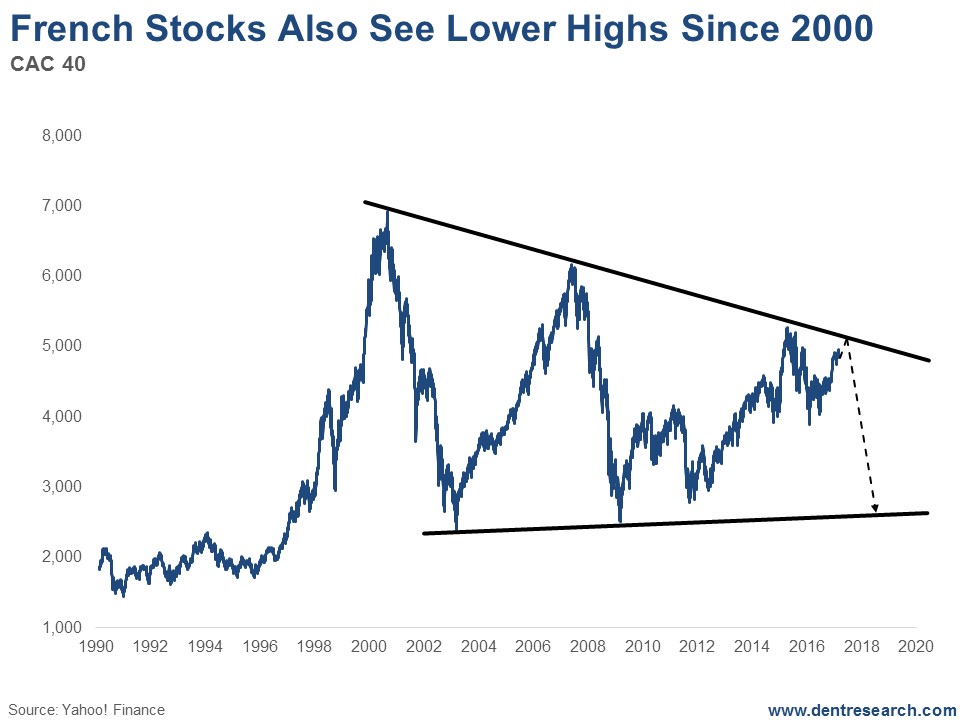
The CAC 40 in France is the chart I’m most watching closely. It’s been trading in a declining wedge since late 1999.

It peaked back then, right near 7,000. Then it lost 66% in the crash. The next major rally took it to 6,200 in 2007, after which it crashed 61%. The rally since early 2009 has been even weaker, taking it just over 5,200 in early 2015. Now it sits at 5,000, 30% below its all-time high.
I’m watching this chart because its top trend-line is approaching the 5,200 mark and that could present strong resistance. This could limit France, and much of Europe’s advance in this final bubble rally, to as little as 4%. If the CAC can break cleanly above 5,200, then the next resistance level is all the way up at 6,200. A run that high doesn’t sound as likely given France’s tenuous position in the euro.
My point is that, outside of the UK and Germany, Europe isn’t doing well. Neither is Japan or China, for that matter, both of which are near 50% off their all-time highs.
That means this final orgasmic global rally is largely confined to the large caps in the U.S., Canada, the UK and Germany. And, except for the U.S., most are making just slight new highs. That’s a huge global divergence that doesn’t bode well for this third and final stock bubble.
