The latest report from Eurekahedge, in its tracking of the health of the hedge fund industry worldwide and month by month, indicates that hedge funds were up 0.40% in May. Reversals in commodity prices in the middle of the month and weak equity performance in developing markets both had an impact on the hedge fund space.
This may well be seen by some investors as disappointing when compared to underlying markets, as measured by the MSCI World Index, which were up 1.28%.
Breaking the overall hedge fund number down by strategic mandates, the distressed debt managers did best, up 1.66% for the month. Event driven funds followed them at 1.29%. Eurekahedge’s commentary says that risk appetite was “sustained in May.”
The distressed debt funds did well on the basis of wins in the high-yield energy and metals sectors. An upward move in the price of natural gas in particular helped push up “the value of specific underlying corporate bonds.”
Parenthetically: that move continues. In mid-June, the Henry Hub Nat Gas Spot Price, per million BTUs, was up to $2.55, a level it hadn’t seen since January.
For the year-to-date numbers, those first and second positions on the tables are reversed. Event driven is best YTD for 2016 as of the end of May, up 2.96%. Distressed debt is second, at 2.66%.
At the losing end of the tables, CTA/managed futures funds did worst in May, down 0.75%. Macro mandated funds were down 0.37%. The only strategy that has posted negative numbers year-to-date is long short equity, which is down 0.55%.
Arbitrage and relative value

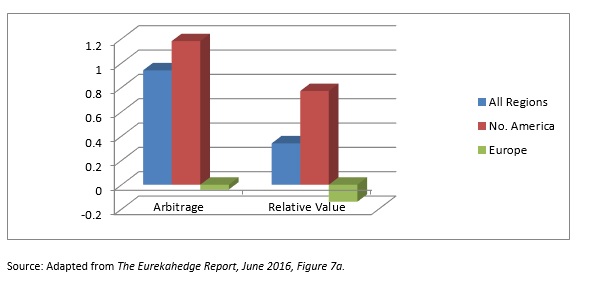
Arbitrage and relative value strategies worked better this month in North America than they did in the rest of the world, and they worked very poorly indeed in Europe.

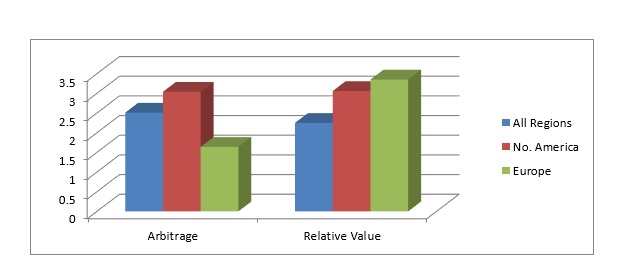
Year-to-date, one gets a somewhat different impression, in that relative value has done better in Europe than in North America over the period of five months that began with New Years’ Day.
The Eurekahedge Arbitrage Hedge Fund Index grew by 2.51% year-to-date in the globe as a whole. North American arbitrage managers saw a YTD increase of 3.04%, while European arbitrage managers gained just 1.64% over the same period.
Asia’s Numbers
Japan-mandated funds have been experiencing their worst year-to-date returns on record, down 2.96%. Nonetheless, this constitutes a dramatic outperformance of the Nikkei 225 Index, which has lost 9.45%.
Nine out of ten Japanese investors say they anticipate further easing from the Bank of Japan, a survey of Japanese investors, also by Eurekahedge, has revealed. The same survey indicated a lot of discontent.
A year ago, 72% of investors thought “Abenomics” was a success. That number is now down to 16%. Monetary easing is one of the so-called “three arrows” of the program of Prime Minister Abe, along with structural reform and fiscal stimulus.
Early in his term, Abe’s program did seem to be a success. But cheap money can work like a stimulative drug, requiring ever higher doses for the same effect and at last becoming either useless or prohibitively dangerous.
The International Monetary Fund expects that Japan’s gross domestic product will increase by only 0.5% this year. Yet the cheap-money dosage has gotten very high: the Bank of Japan buys 80 trillion yen a year worth of the government’s bonds. That’s $740 billion. So there is a lot of context to the hedge funds’ negative number in Japan YTD.
In the context of this terrible year, the May monthly result looks good. Hedge funds made a 1% return in Japan in May.
Meanwhile, in Asia ex-Japan … Eurekahedge tells us that managers gained 0.23% during the merry month of May and that they’ve less merrily lost 2.11% year-to-date. Nonetheless, they had assets under management of 0.26% more at the end of May than they had had AUM at the start of the year, because the inflow more than made up for the performance-based loss.
The commentary attributes the lackluster performance of managers with Asia ex-Japan mandates to the sell-off in China’s markets. But “positive business announcements” in the information technology space in China “led specific stocks higher” into May.
