EUR/USD: Technical Analysis Suggests Recovery, But Watch Non-Farm Payrolls
- Final Eurozone Composite PMI fell to 53.0 last month from January's 53.6, its lowest reading since the start of 2015. That was ahead of the preliminary reading of 52.7, however, and comfortably over the 50 mark that denotes growth.
- An additional cut to the ECB's deposit rate is almost certain when it next meets on March 10. The central bank is also likely to increase the size of its bond-buying programme from EUR 60 billion a month.
- San Francisco Federal Reserve President John Williams said on Wednesday there has been no substantial change in his outlook on the US economy or his opinion on the number of times the Fed should raise interest rates this year and next. Striking an optimistic tone that stands in contrast with some of his more cautious colleagues, Williams said he is not worried that the global economic slowdown, stock-market sell-off and the oil price slide since the beginning of the year will knock the US recovery off its tracks or send the economy into recession. Williams added that the key message from the US central bank is that interest-rate hikes will be "gradual."
- The Federal Reserve said in its Beige Book that US economic activity continued to expand in most districts from early January to late February but conditions varied considerably across regions and within sectors. Manufacturing activity was flat as it continued to hurt from a strong dollar, weak demand from the energy sector and a deteriorating global outlook. Consumer spending increased in the majority of districts. In a positive sign for the Fed, wages generally increased. The St. Louis Fed reported its strongest assessment of wage growth in two years, although some other districts saw easing wage pressures.
- ADP National Employment Report showed US private employers added 214k jobs in February, above market expectations, suggesting solid job growth despite market turmoil and worries about a slowing global economy. Private payroll gains in the month earlier were revised down to 193k from an originally reported 205k increase. The ADP figures come ahead of the US Labor Department's more comprehensive non-farm payrolls report on Friday, which includes both public and private-sector employment. Total non-farm employment is expected to be 190k. We expect slightly weaker reading. The unemployment rate is forecast to stay steady at 4.9%, unchanged from a month earlier
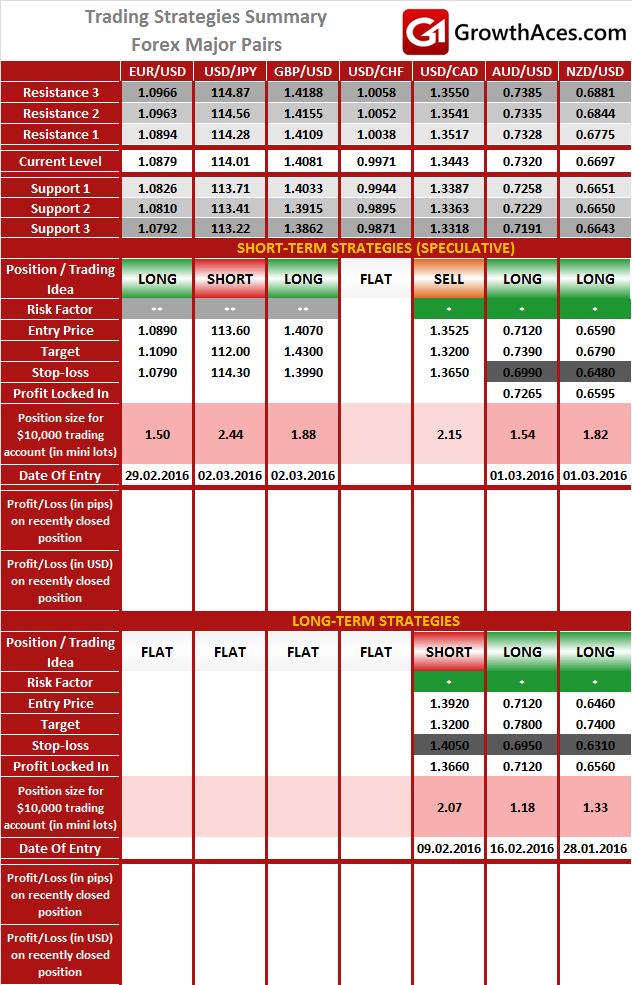
- The EUR/USD is fluctuating near 1.0868 (76.4% retrace of the 1.0711-1.1377 rise). 1.0868 has been where Ichimoku cloud top has been until Thursday when it dropped to 1.0866. Failure to action a daily close below the cloud top is a bit of a setback for bears. A recovery in EUR/USD is likely now from the technical analysis’ point of view. Friday’s non-farm payrolls pose a risk to our long position.
AUD/USD: Target Raised To 0.7390
- The AUD held near two-month highs against the USD dollar on Thursday, as a rally in commodities and supportive domestic data prompted markets to pare back the chance of a future interest rate cut. Interbank rate futures showed a 60% chance of a quarter point cut in interest rates by mid-year, down from nearly 100% a few weeks ago. Fading expectations for a rate cut are pretty in line with our forecast. We are the opinion that the Reserve Bank of Australia will not cut interest rates in the coming months.
- The AUD was underpinned by better-than-expected trade figures showing the domestic deficit a touch lower at AUD 2.9 billion in January, from AUD 3.5 billion the previous month.
- The Aussie had already been buoyed by data on Wednesday showing the economy grew at the fastest pace in almost two years, a hopeful sign the worst of the global commodity rout may be over.
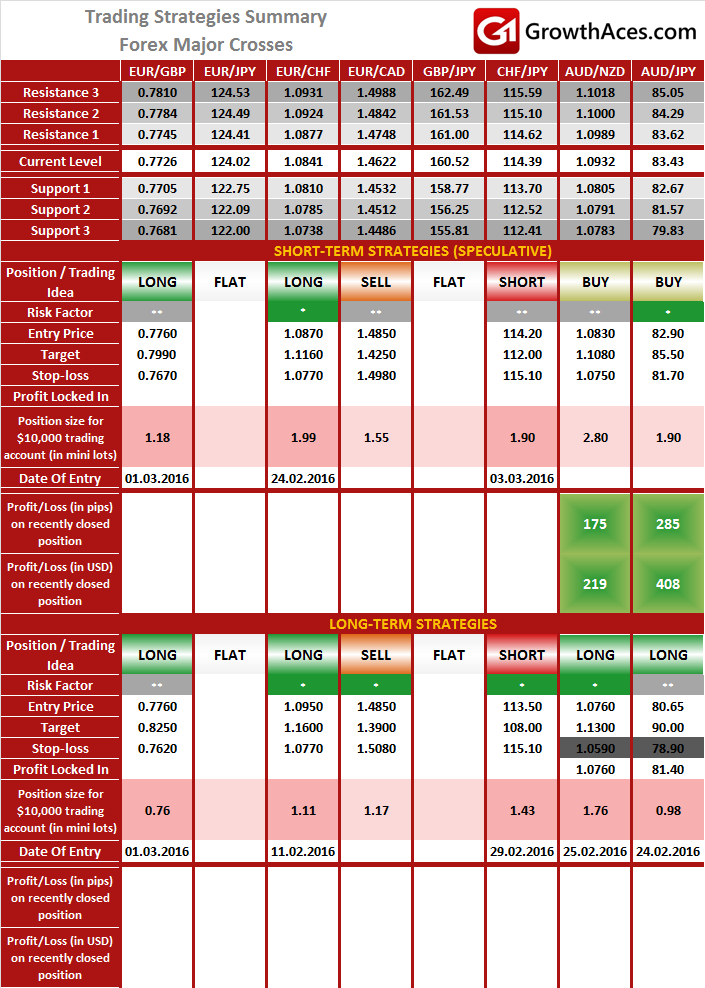
- The AUD/USD met a wall of resistance around the 0.7300 level, a level tested three times this year. A sustained break would target the December high of 0.7386. We raised the target on our AUD/USD long to 0.7390 and locked in profit at 0.7265. We took profit on AUD/NZD long at 1.0935 and on AUD/JPY long at 83.50.
FOREX - MAJOR PAIRS:
FOREX - MAJOR CROSSES:
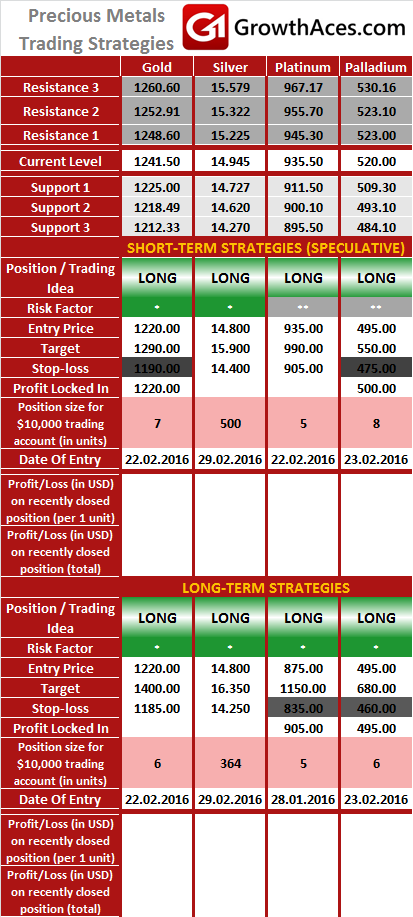
PRECIOUS METALS:
It is usually reasonable to divide your portfolio into two parts: the core investment part and the satellite speculative part. The core part is the one you would want to make profit with in the long-term thanks to the long-term trend in price changes. Such an approach is a clear investment as you are bound to keep your position opened for a considerable amount of time in order to realize the profit. The speculative part is quite the contrary. You would open a speculative position with short-term gains in your mind and with the awareness that even though potentially more profitable than investments, speculation is also way more risky. In typical circumstances investments should account for 60-90% of your portfolio, the rest being speculative positions. This way, you may enjoy a possibly higher rate of return than in the case of putting all of your money into investment positions and at the same time you may not have to be afraid of severe losses in the short-term.
How to read these tables?
1. Support/Resistance - three closest important support/resistance levels
2. Position/Trading Idea:
BUY/SELL - It means we are looking to open LONG/SHORT position at the Entry Price. If the order is filled we will set the suggested Target and Stop-loss level.
LONG/SHORT - It means we have already taken this position at the Entry Price and expect the rate to go up/down to the Target level.
3. Stop-Loss/Profit Locked In - Sometimes we move the stop-loss level above (in case of LONG) or below (in case of SHORT) the Entry price. This means that we have locked in profit on this position.
4. Risk Factor - green "*" means high level of confidence (low level of uncertainty), grey "**" means medium level of confidence, red "***" means low level of confidence (high level of uncertainty)
5. Position Size (forex)- position size suggested for a USD 10,000 trading account in mini lots. You can calculate your position size as follows: (your account size in USD / USD 10,000) * (our position size). You should always round the result down. For example, if the result was 2.671, your position size should be 2 mini lots. This would be a great tool for your risk management!
Position size (precious metals) - position size suggested for a USD 10,000 trading account in units. You can calculate your position size as follows: (your account size in USD / USD 10,000) * (our position size).
6. Profit/Loss on recently closed position (forex) - is the amount of pips we have earned/lost on recently closed position. The amount in USD is calculated on the assumption of suggested position size for USD 10,000 trading account.
Profit/Loss on recently closed position (precious metals) - is profit/loss we have earned/lost per unit on recently closed position. The amount in USD is calculated on the assumption of suggested position size for USD 10,000 trading account.
Source: Growth Aces Forex And Precious Metals Trading Strategies
