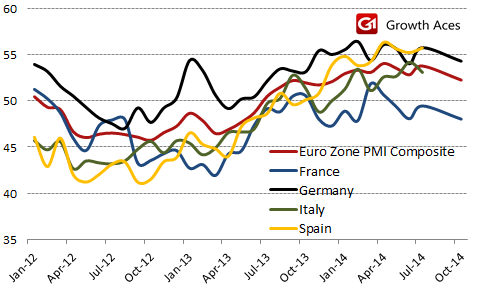
- The Euro zone PMI composite index rose in October from September’s ten-month low of 52.0 to 52.2. The reading was the second-weakest reading seen so far this year. Manufacturing output expanded at the fastest rate for three months (edged up to 50.7 from 50.3), while growth of service sector activity was unchanged from the previous month.
- PMI details show some skeletons in the closet. Although output rose at a slightly faster rate, new orders barely rose in October. Service providers reported the first cut in payroll numbers since March, though manufacturers reported a slight upturn in employment. Average prices charged for goods and services showed the largest monthly fall since February 2010.
- For now, the PMI points to quarterly GDP growth of around 0.2%. The breakdown by country showed another fall in the French, suggesting business activity deteriorating at the fastest rate since February. In Germany PMI rose to its highest for three months, giving a hope that the economy will recover slowly from the downturn in the middle of the year.
- Despite better-than-expected reading, the PMIs details do not lower risks of recession or deflation in the Euro zone. The European Central Bank is still under pressure to provide more monetary policy support by increasing its balance sheet.
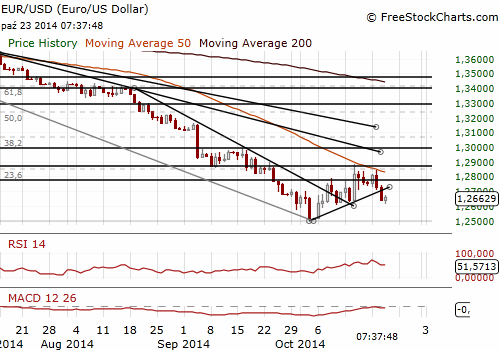
- The EUR/USD recovered after unexpected pick up of PMI in October from a two-week low of 1.2614. We lowered our sell offer yesterday to the level of 1.2760. After getting short we will set the target in the area of 1.2580/12600. In the opinion of GrowthAces.com there is still potential for a move to test the 2014 low at 1.2501 (October 3).
- We went long on the EUR/JPY at 135.20. The short-term target is 137.30.
- The Bank of Canada kept the overnight rate at 1%, as widely expected. The Bank of Canada dropped any reference to taking a neutral stance on interest rates. In September it had said it was neutral on the timing and direction of rate changes. That was a big surprise.
- The bank voiced new concern about the heated housing market and household debt. On the other hand it said underlying inflationary pressures remained muted and the risks to its inflation projection were roughly balanced.
- The Bank of Canada further pushed back the time frame for when it reckoned the economy would reach full capacity, to the second half of 2016 from the mid-2016 estimate in July. It also delayed by one quarter to the fourth quarter of 2016 the time when it expects total and core inflation to settle at its 2% target.
- Canadian retail sales dropped unexpectedly 0.3% mom in August, pulled down by lower gasoline prices and weaker sales of new cars, food, and housing-related items.
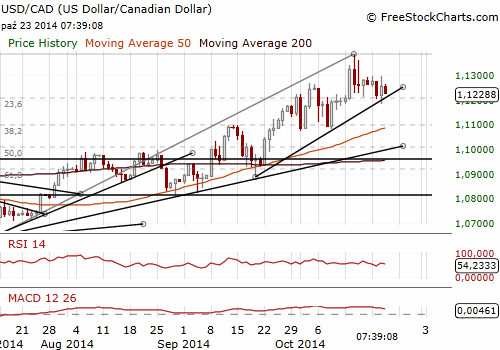
- The CAD touched its weakest level of the session after August retail sales unexpectedly declined. The CAD recouped its losses and strengthened to a session high after the Bank of Canada dropped its reference to neutrality in its rate statement. The USD/CAD fell to session low of 1.1184. Our long USD/CAD position reached the stop-loss level at 1.1200.
- That was not the end of volatile session on the USD/CAD. The attention of investors was diverted by the news that Canadian Parliament Hill came under attack as a man with a rifle shot and killed a soldier standing guard at the National War Memorial in downtown Ottawa. The USD/CAD recovered to break above 1.1260 at the end of the day.
- We stay sideways now but are looking to go long again at lower levels. From the technical point of view the failure to close below 23.6% of 1.0620-1.1385 (at 1.1205) added to the upside potential.
- Retail sales volumes fell 0.3% mom and went up by 2.7% yoy. The reading was weaker than the median forecast. The Office for National Statistics said mild weather in September put shoppers off buying winter clothes, the main driver of the fall.
- In the opinion of Bank of England Deputy Governor Ben Broadbent the bank is only likely to raise interest rates gradually, as headwinds to growth and long-term downward pressures on borrowing costs pass. He said current, very low, inflation- and risk-adjusted returns on investments would probably rise as productivity improved. Broadbent reiterated the BoE's existing position that it would not reduce its GBP 375 bn of bond holdings until it had raised interest rates some way above their current record-low level.
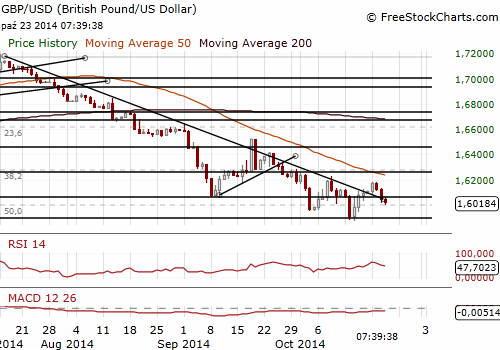
- The most important event for the GBP/USD traders is the first estimate of third-quarter GDP growth on Friday. In case of weaker reading we may see a fall to 1.5875 lows from the last week. The nearest important support level is 1.5994 (61.8% of 1.5875-1.6186).


Significant technical analysis' levels:
Resistance: 1.2693 (21-dma), 1.2725 (10-dma), 1.2740 (high Oct 22)
Support: 1.2605 (low Oct 10), 1.2583 (low Oct 7), 1.2504 (low Oct 6)
USD/CAD: Weak retail sales data, surprise from the BOC and shootings at Ottawa parliament
(our long position reached the stop-loss level, the outlook is still bullish)

Significant technical analysis' levels:
Resistance: 1.1297 (high Oct 21), 1.1360 (high Oct 16), 1.1385 (high Oct 15)
Support: 1.1232 (session low Oct 23), 1.1203 (21-dma), 1.1184 (low Oct 22)
GBP/USD tested 1.6000 after weak retail sales data
(the outlook is mixed, eyes on Friday’s GDP now)

Significant technical analysis' levels:
Resistance: 1.6064 (10-dma), 1.6115 (21-dma), 1.6130 (high Oct 22)
Support: 1.5994 (61.8% of 1.5875-1.6186), 1.5940 (low Oct 16), 1.5875 (low Oct 15)
