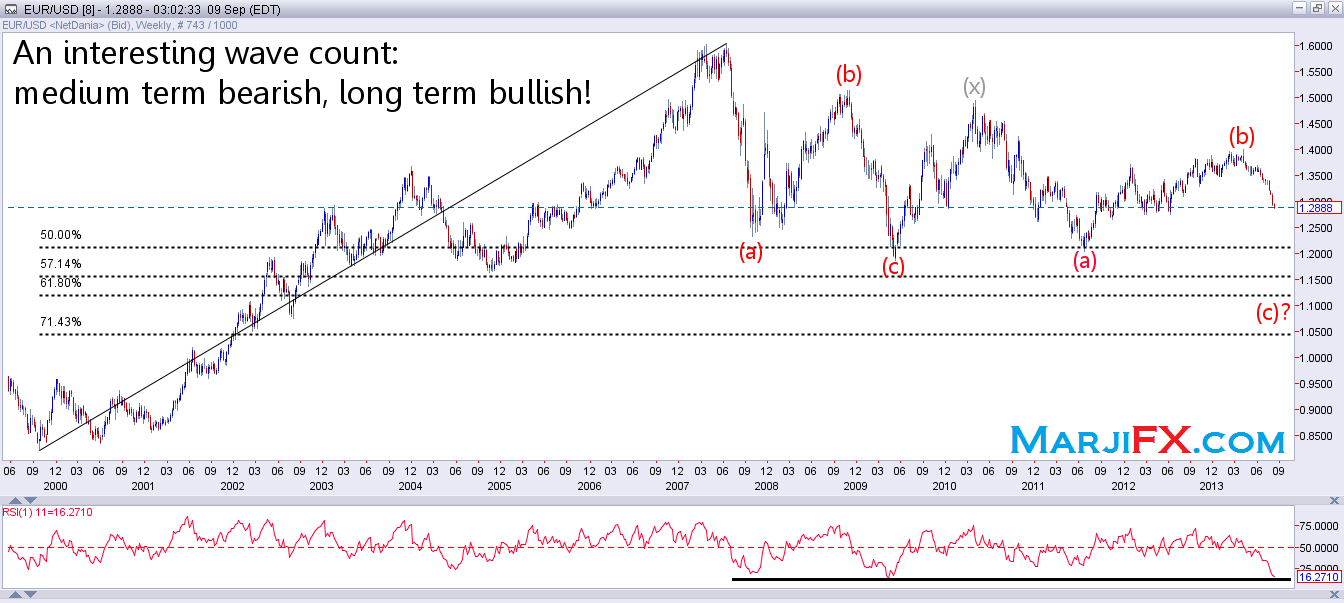
EUR/USD: Breaking 1.3101 was the big technical event seen last week, and it was no surprise to see this break resulting in a drop to a 14-month low at 1.2865 during today's Asian session. As said in previous reports, breaking below this key level would deteriorate the medium term outlook, and it certainly did!
Breaking such a key level meant that the falling move from July’s top 1.3991 is most probably not a correction for the rising move from the 2013 yearly low 1.2753. This means that it is either a correction for the whole move from 2012 yearly low 1.2041, or that it is not a correction to begin with, but a trending impulse move! Both of these possibilities mean that the Euro is going to suffer for weeks, may be months to come!
This break has led me to check the long term charts, and as can be seen on the attached weekly chart, the Euro was in an obvious uptrend from 2000 to 2008, when it started losing value from its historical high 1.6037. After that, we have been swinging up and down in what is hard to consider anything but a “double zigzag” type of correction. If the wave count on the chart is correct, then wave (c) will be expected to target levels below the bottom of wave (a), which was 1.2041.
What can also be seen on the attached chart is that the falling moves from 2008 historical high has reached the Fibonacci 38.2% and the Fibonacci 50% retracement levels. The 3 key retracements which come next are the Marji 57.1% retracement at 1.1570, the Fibonacci 61.8% at 1.1206 and the Marji 71.4% at 1.0456. It is seriously hard to imagine the Euro trading at these levels at the moment, but if we are actually in wave (c), which is notorious for being vicious and brutal, we could see at least one of those levels, may be by the beginning of 2015.
However, on the long term, things look so bright, because after a double zigzag, the price will be expected to surpass the top from which this double zigzag started from, which was 1.6037! That would be very interesting to witness. The second lowest RSI on the chart seems to support this idea. The last time the weekly RSI reached these low levels, the price bounced up more than 3000 pips!
On the shorter term, there are no key resistance levels ahead of 1.3046. Nevertheless, the bottom of the intraday channel which can be drawn using Friday’s and Monday’s highs is very close to the current daily high 1.2899. A break above this level will be a first sign of short term strength, which would give the bulls a chance to test 1.2977 or 1.3012 ahead of the important 1.3046. A break above this level would most probably mean that we have seen an important short term bottom at 1.2865, and that the price will continue moving higher. In this case 1.3138 makes an attractive target, along with 1.3202.
As for the support level, they start at today’s fresh 14-month low 1.2865, ahead of what looks to be an important level at 1.2804, without neglecting 1.2753. We also should pay attention to the long term Fibonacci 61.8% retracement at 1.2786. An accurate stop at this level means a lot.
Chart:

Support:
• 1.2865: today's fresh 14-month low.
• 1.2804/10: a small support area combined of the daily lows for July 4th and 7th 2013.
• 1.2786: the long term Fibonacci 61.8% calculated for the whole gigantic move from 2012 yearly low 1.2041 to 2014 yearly high 1.3991.
• 1.2753: July 8h 2013 daily low, and major bottom.
• 1.2716: Nov 7th daily low.
• 1.2689: Nov 8th daily low.
Resistance:
• 1.2899: today’s current daily high at the time of preparing this report. This level is very close to the bottom of the intraday channel which can be drawn using Thursday’s and Monday’s highs.
• 1.2929: a technically important intraday bottom seen yesterday.
• 1.2977: micro term Fibonacci 38.2% calculated for the drop from September 3rd high 1.3158 to today’s 14-month low 1.2865.
• 1.3012: micro term Fibonacci 50% calculated for the drop from September 3rd high 1.3158 to today’s 14-month low 1.2865.
• 1.3046: micro term Fibonacci 61.8% calculated for the drop from September 3rd high 1.3158 to today’s 14-month low 1.2865. This is probably the most important resistance for now.
• 1.3073: short term Fibonacci 38.2% calculated for the drop from August 15th high 1.3410 to today’s 14-month low 1.2865.
• 1.3138: short term Fibonacci 50% calculated for the drop from August 15th high 1.3410 to today’s 14-month low 1.2865.
• 1.3176: short term Marji 57.1% calculated for the drop from August 15th high 1.3410 to today’s 14-month low 1.2865.
• 1.3202: short term Fibonacci 61.8% calculated for the drop from August 15th high 1.3410 to today’s 14-month low 1.2865.
Trend:
• Short term: Down, as long as the price is below 1.3046.
• Medium term: Down, as long as the price is below 1.3460.
• Long term: Down, as long as the price is below 1.4109.
Article originally appeared on MarjiFX.com
