EUR/USD
All of its good work has been undone quickly as the euro has fallen sharply from the resistance level around 1.3550 to nearly touch 1.34 before recovering a little in the last couple of hours. This was after the last few weeks which saw it move steadily higher from a support level at 1.33 which resulted in a move to a three week high just above 1.3550. For some time now the 1.3550 has been a key level and this may continue to play a role. Towards the end of October the euro enjoyed a strong surge higher to move through to its highest level in nearly two years just above 1.38 before spending that week content to consolidate around this level. Over the following three weeks it fell heavily down to a support level at 1.33 before recovering well over the last few weeks. It moved quite well throughout the middle of October after breaking higher from its sideways range. For the month leading up to that, the euro traded within a narrow range between 1.3450 and 1.3650 before the range narrowed down to between 1.35 and 1.36. The former level of 1.35 was strongly tested a few weeks ago and has resurfaced as a significant level presently.
Throughout August the 1.34 level had been causing the euro headaches however several weeks ago it surged higher and moved through there to its then highest level since February just shy of 1.3570, which was past a couple of weeks ago moving to just shy of 1.3650. About a month ago the euro fell strongly away from the resistance level at 1.34 back to below the support level at 1.32 and in doing so traded to its lowest level in seven weeks very close to 1.31. Looking at the bigger picture the euro spent a lot of August and September trading within a range between 1.32 and 1.34 before recently pushing its range to between 1.3450 and 1.3650. Back in early July the euro was content to maintain the level above 1.31 and settle there, as it received solid support from both 1.30 and 1.31. On a couple of occasions it made an attempt to move within reach of the longer term resistance level at 1.32 and finally it finds itself trading on the other side of this level and being well established there.
Throughout May and most of June the euro surged higher to a four month high above 1.34. Before that in the first half of May, the euro fell considerably from near 1.32 down to six week lows near 1.28. Back at the beginning of April the euro received solid support around 1.28 and this level was called upon to provide additional support. Throughout this year the euro has moved very strongly in both directions. Throughout February and March the euro fell sharply from around 1.37 down to its lowest level since the middle of November around 1.2750. Sentiment has completely changed with the euro over the last few weeks and the last couple of months has seen a rollercoaster ride for the euro as it continued to move strongly towards 1.34 before falling very sharply to below 1.29 and setting a 6 week low.
Euro zone inflation indicators continue to post numbers far below the ECB’s inflation target of 2.0%. German Producer Price Index dipped 0.2%, its third decline in the past four releases. The estimate stood at 0.1%. The low inflation numbers underscore weak economic activity in the euro zone, and this could make things difficult for the euro .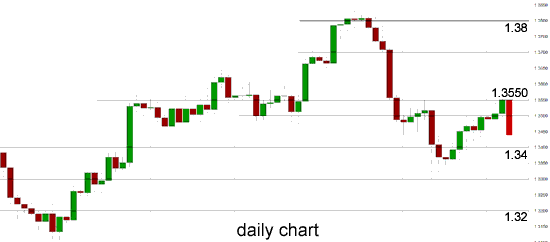 EUR/USD Daily Chart" title="EUR/USD Daily Chart" width="551" height="243">
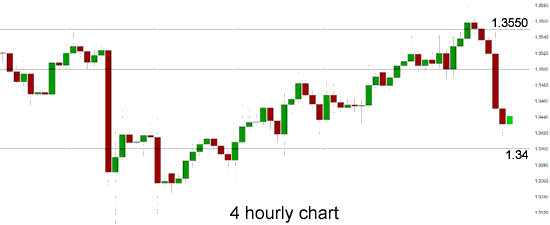 EUR/USD 4 Hourly Chart" title="EUR/USD 4 Hourly Chart" width="551" height="243">
EUR/USD November 20 at 21:50 GMT 1.3438 H: 1.3553 L: 1.3415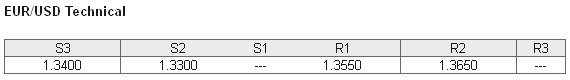 EUR/USD Technical Chart" title="EUR/USD Technical Chart" width="551" height="243">
During the early hours of the Asian trading session on Thursday, the euro is trying to claw back some ground after its strong fall from near 1.3550. Current range: just above 1.3420.
Further levels in both directions:
• Below: 1.3400 and 1.3300.
• Above: 1.3550 and 1.3650. EUR/USD Position Ratios Chart" title="EUR/USD Position Ratios Chart" width="551" height="243">
(Shows the ratio of long vs. short positions held for the EUR/USD among all OANDA clients. The left percentage (blue) shows long positions; the right percentage (orange) shows short positions.)
The EUR/USD long position ratio is climbing towards 40% as the euro has dropped sharply back towards 1.3400. The trader sentiment remains in favour of short positions.
Economic Releases
- 08:58 EU Flash Manufacturing PMI (Nov)
- 08:58 EU Flash Composite PMI (Nov)
- 08:58 EU Flash Services PMI (Nov)
- 09:30 UK Public Borrowing (PSNB ex interventions) (Oct)
- 11:00 UK CBI Industrial Trends (Nov)
- 13:30 US Initial Claims (15/11/2013)
- 13:58 US Flash Manufacturing PMI (Nov)
- 13:30 US PPI (Oct)
- 15:00 EU Flash Consumer Sentiment (Nov)
- 15:00 US Philadelphia Fed Survey (Nov)
- EU ECB Governing Council hold non-rate setting meeting
- JP BoJ MPC - Overnight Rate (Nov)