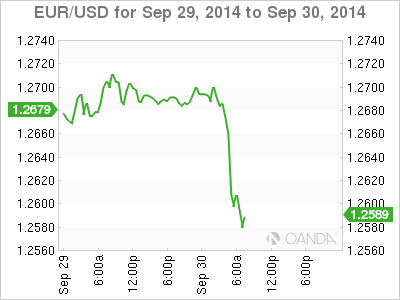
The 18-member single unit has managed to fall to a fresh two-year low outright this morning, briefly penetrating the psychological €1.26 handle (€1.2595), just as capital market-bid farewell to another volatile September and third quarter. While at the same time Euro equities have been edging higher, trying to revers in part some of yesterday’s decline while waiting for this morning’s inflation data that some investors expect could very much shape the ECB’s next move.
From a global perspective, the key to any defining rally or equity retreat currently lies with Hong Kong. Growing protest in the region is once again encouraging many investors to stay on the sidelines. Regional indices have wavered to the downside on signs that the standoff between Occupy Central and the authorities will not be subsiding any time soon. Ahead of the start of China’s National Day holidays, the Shanghai Composite and the Hang Seng have both been finding it difficult to maintain positive traction. Currently, HK chief Leung is warning local businesses that protests may last for a long time, but also noted there is no need to ask for deployment of the PLA (China People’s Liberation Army), expressing confidence in local authorities. Emerging market currencies are relatively quiet compared to yesterday, with no real ‘fresh’ news coming from the protests in Hong Kong. All the forex action has so far been driven out of Europe.

Euro inflation falls further
Putting further pressure on the EUR this morning is the eurozone’s annual rate of inflation having fallen further below the ECB’s target in September, to it’s lowest level in five-years. The eurozone’s flash HICP has come in at +0.3%, which compares to a final reading of +0.4% in August. After the German HCIP surprise yesterday (+0.0% vs. -0.1%) it was expected that the headline number would come as expected. But more of an interest is the core-rate of inflation; it has fallen to +0.7% compared to +0.9% – further weighing on the EUR outright and on the crosses (GBP and JPY in particular). Many believe that a result below expectations would be of particular interest to Draghi and company, as inflation to them is the ECB’s official argument that might lead to QE. Nevertheless, a decline was mostly expected and is unlikely to prompt an immediate response from the ECB this Thursday at its monetary policy meeting in Italy.
ECB policy makers are still expected to take some time to access the impact of the two waves of stimulus programs introduced last June (negative deposit rates/ further credit and purchases of ABS/covered bonds). Many forecasters do not anticipate euro policy makers to jump the gun as they believe the “base effect” (food and energy prices – which are historically very low) to climb in October. Nevertheless, Euro inflationary pressures are likely to remain soft for some time. Euro survey’s released yesterday revealed that both businesses and consumers were more ‘downbeat’ about their prospects in September than anytime since the end of last-year.
So far, the initial market reaction to the softer inflation reading has both US treasuries and Gilt yields rising after declining during yesterday’s session. While eurozone debt yields are moving lower following the CPI data. European officials, especially the French, continue to express their content with a weaker EUR. It’s not surprising to see peripheral equity indices being supported by the weaker than expected core-CPI data.

The EUR cross sees ‘red’
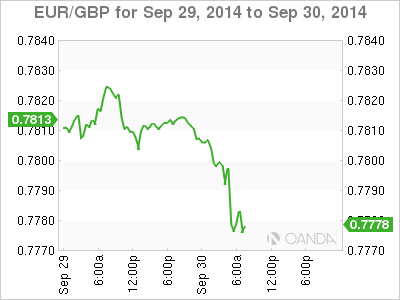
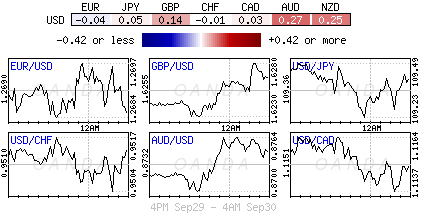
On the cross, the 18-member single unit continues to naturally underperform. Cable managed a kneejerk £1.6275 high after a +0.1% upward revision to the UK’s Q2 GDP, to +0.9% and then saw it’s subsequent low outright so far (£1.6194) as the market’s focused shifted to the bigger UK current account deficit (-£23b vs. -£17b expected or +5.2% of GDP). The pound’s break of the £1.62 handle was spurred by the EUR’s outright losses on the back of weaker inflation data. This has managed to push EUR/GBP to a 26-month low €0.77785. Asia’s low at £1.6225 is now a cable resistance level while the sterling bear’s will now be targeting £1.6162, the mid-September low and £1.6052 (10-month low on September 10).

Yen handcuffed for now
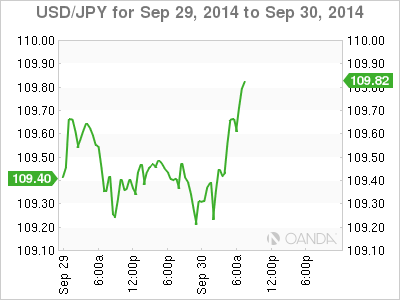
USD/JPY has been trading heavy on Japanese fiscal year-end flows with many investors happy to lock in profits on USD’s and Nikkei longs. It seems that Japanese portfolio are happy to pare back some of their global stock allocations. BoJ officials remain optimistic. Expect the market to begin to anticipate further measures only if September data happens to be weak as well. Currently, Japanese exporters are dollar sellers ahead of ¥109.75 and the highly profile ¥110.00 level. Japanese importers and investors have bids scattered ahead of ¥109.00. AS to be expected EUR/JPY (€138.20) under pressure from the EUR’s outright move lower on the back of a weak eurozone inflation report.

