
No change in the bigger picture view of a large, bearish head and shoulders pattern forming since April, and with an eventual downside resolution of the neckline (cur at 125) favored. In the Jul 2nd email, we said that the market was in an "ideal" area to form a more major top just above 131 (area of potential right shoulder) as well as an "ideal" time (where the time of the left shoulder to the head was the same as the head to that right shoulder, as the tend toward equality, see daily chart below). The market has indeed chopped lower since, with declines below the neckline still favored ahead. Note too that the $/yen has indeed rolled over from the Jul 8th high at 101.50, targeting eventual declines back to the June low at 93.85 and even below, and in turn adding to this bearish view in eur/yen. Shorter term there is some scope for another few days of ranging and potentially even a break back above the 131 area, but such a move would be seen as part of a larger topping, and not the start of major, new upleg. Resistance is seen at the bearish trendline from the May high (currently at 130.40/55), then 131.10/35 (Jul 2nd high, area of right shoulder). Support is seen at 127.95/10 (yesterday's low, 50% from the Jun low at 125.05).
Strategy/position:
Still short from Jul 2nd at 103.75 (approach of the neckline) and would continue to use a wide stop on a close above 130.75 to allow for further, temporary topping. But will want to switch to a more aggressive stop on further weakness and especially an approach of the neckline, as there is some risk for a more extended period of topping (before resolving lower).
Long term outlook:
No change in the long held view of an important top at the May high at 133.80, within the long discussed "ideal" area for a major top in the 133/134 resistance area (both a 50% retracement from the July 2008 high at 170.00 and then the rising trendline from March 2012, see weekly chart/2nd chart below), and as the market is seen completing the whole upmove from the Jul 2012 low at 94.15. Note that the upmove (from July 2012) lasted 10 months but this correction has even lasted 2 months (so far), is likely not long enough "time-wise", and suggests at least another month or 2 of downside ahead. Note too that longer term technicals remain weak (see sell mode on the weekly macd at bottom of 2nd chart below), and the bearish head and shoulders pattern since April (see shorter term above), add to this negative outlook. Key longer term support (and eventual downside targets) below the 125 area (neckline) is seen at 118.60/85 (March/Apr lows) and 113.75/00 (50% retracement from the July 2012 low at 94.15).
Strategy/position:
With at least another few months of downside favored, would stay with the longer term bearish bias that was put in place on May 15th at 131.65.
Current:
Nearer term : reached sell target from Jun 25th email at 130.75 on Jul 2nd, for 125 area and below.
Last: short Jun 13 at 126.65, small prof Jun 17 above t-line from Jun 11 (125.60, closed 126.30, 30 ticks).
Longer term : bearish bias May 15th at 131.65, another few months of downside ahead.
Last : bullish bias on Aug 6th at 97.50 to neutral Mar 5th at 121.75 (+25%). 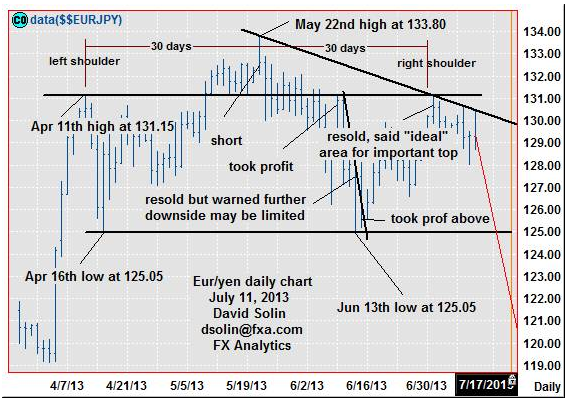 EUR/JPY 1" title="EUR/JPY 1" width="569" height="404">
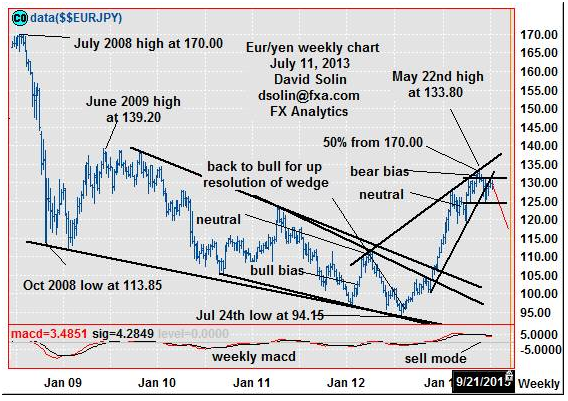 EUR/JPY 2" title="EUR/JPY 2" width="568" height="401">
- English (UK)
- English (India)
- English (Canada)
- English (Australia)
- English (South Africa)
- English (Philippines)
- English (Nigeria)
- Deutsch
- Español (España)
- Español (México)
- Français
- Italiano
- Nederlands
- Português (Portugal)
- Polski
- Português (Brasil)
- Русский
- Türkçe
- العربية
- Ελληνικά
- Svenska
- Suomi
- עברית
- 日本語
- 한국어
- 简体中文
- 繁體中文
- Bahasa Indonesia
- Bahasa Melayu
- ไทย
- Tiếng Việt
- हिंदी
EUR/JPY: Near Term Bearish Outlook
Published 07/14/2013, 03:01 AM
Updated 07/09/2023, 06:31 AM
EUR/JPY: Near Term Bearish Outlook
3rd party Ad. Not an offer or recommendation by Investing.com. See disclosure here or
remove ads
.
Latest comments
Install Our App
Risk Disclosure: Trading in financial instruments and/or cryptocurrencies involves high risks including the risk of losing some, or all, of your investment amount, and may not be suitable for all investors. Prices of cryptocurrencies are extremely volatile and may be affected by external factors such as financial, regulatory or political events. Trading on margin increases the financial risks.
Before deciding to trade in financial instrument or cryptocurrencies you should be fully informed of the risks and costs associated with trading the financial markets, carefully consider your investment objectives, level of experience, and risk appetite, and seek professional advice where needed.
Fusion Media would like to remind you that the data contained in this website is not necessarily real-time nor accurate. The data and prices on the website are not necessarily provided by any market or exchange, but may be provided by market makers, and so prices may not be accurate and may differ from the actual price at any given market, meaning prices are indicative and not appropriate for trading purposes. Fusion Media and any provider of the data contained in this website will not accept liability for any loss or damage as a result of your trading, or your reliance on the information contained within this website.
It is prohibited to use, store, reproduce, display, modify, transmit or distribute the data contained in this website without the explicit prior written permission of Fusion Media and/or the data provider. All intellectual property rights are reserved by the providers and/or the exchange providing the data contained in this website.
Fusion Media may be compensated by the advertisers that appear on the website, based on your interaction with the advertisements or advertisers.
© 2007-2024 - Fusion Media Limited. All Rights Reserved.