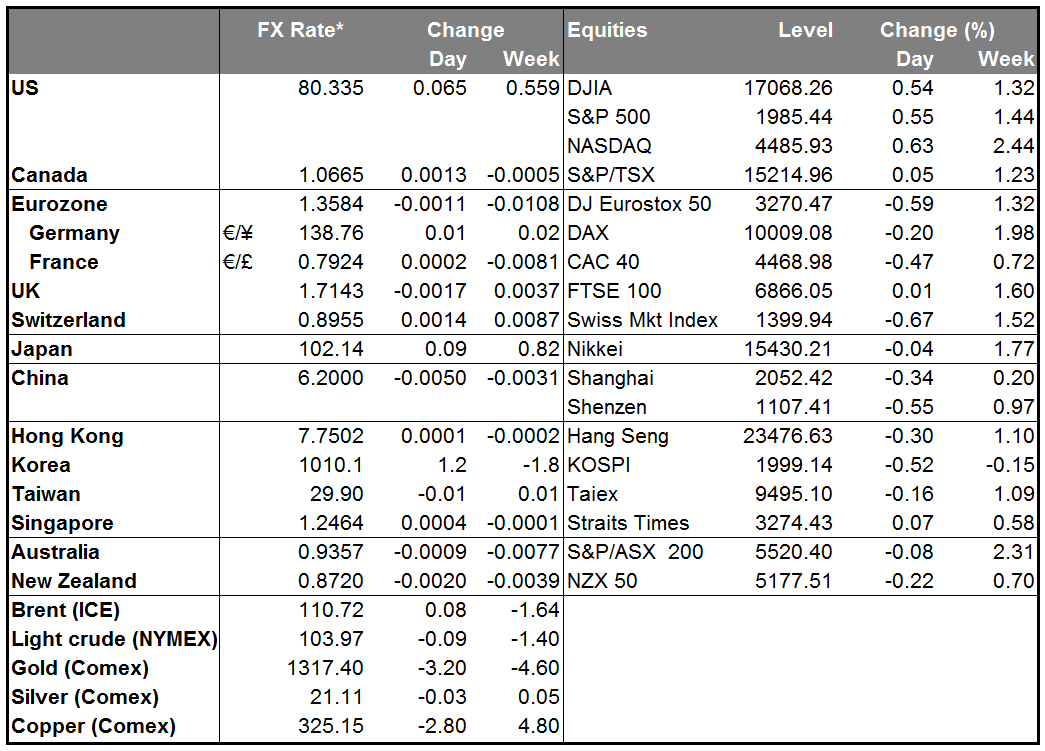
The US Dollar was unchanged or higher against its other G10 counterparts in the wake of last week's solid US jobs data. Last week's data prompted traders to slightly increase bets that the Fed will lift rates in June next year. Several economists toyed with the idea of bringing forward their forecasts for a Fed rate hike, although most held firm. We continue to believe that the market will eventually have to bring its forecasts more into line with the FOMC's more aggressive forecasts for Fed Funds and that this change will cause the dollar to strengthen over the next several months. Indeed, given the strong employment data released last week, we could even see the FOMC moving up its forecasts, which would cement the policy divergence that's underpinning the dollar.
On Friday, Sweden’s finance minister changed nation’s economic growth forecast for this year and next, citing lower-than-expected demand for the country’s exports adding to the loses of Swedish krona. The largest Nordic economy is now expected to expand 2.5% this year, compared with April estimates of 2.7%. Although SEK has weakened considerably, we still believe it is likely to weaken further over the medium term.
On Wednesday, Fed will release the minutes from its 17-18 June meeting. The statement from the meeting was judged as relatively dovish albeit the projection for leading fed funds rate was revised slightly higher by FOMC members. In particular, Janet Yellen downplayed the recent increase in inflation at the press briefing. It will be interesting to see if this view is broadly shared by other FOMC members. Also, the market will be looking for any indications of when the Committee members think it will be appropriate to begin raising rates.
The Bank of England's MPC are unlikely to alter policy in their meeting on Thursday, but the risk of a rate rise is higher than it has been before. One thing that will matter for rate rise timing is growth momentum in the second half. Manufacturing and industrial production on Tuesday and construction data end of this week will give us more insights about how Q2 has turned out. While the meeting itself is likely to be another non-event for the market, as usual, the minutes of the meeting, which will be released on the 23rd of July, will be keenly watched and should prove more important.
Today: During the European day today, the main event will be Germany’s industrial production for May. The forecast is for the pace of output to have remained unchanged on a monthly basis, whereas the yoy rate is expected to have accelerated. Canada’s building permits for May are forecast to have increased in pace compared to the previous month.
We have two speakers scheduled on Monday’s agenda. ECB Governing council member Ewald Nowotny and Swedish Riksbank Governor Stefan Ingnes.
As for the rest of the week, the calendar remains light. Besides the UK’s industrial and manufacturing production figures for May we get Switzerland CPI for June. We also get Japan’s current account balance and German trade balance figures, both for May. On Wednesday, during the Asian morning we get China’s CPI and PPI for June, while from Australia, we get the Westpac consumer confidence index for July. In the US, the FOMC release the minutes of their latest policy meetings, whereas from Canada, we get housing starts for June. On Thursday, in addition to the BoE meeting, Australia releases its unemployment rate for June, while from Japan, we get machinery orders and Tertiary industry activity both for May and PPI for June. During the European day, we get June CPI data from Sweden and Norway. French June CPI data is also released, alongside nation’s industrial and manufacturing production for May. Finally on Friday, the main indicators released will be Canada’s unemployment rate for June and German final CPI for the same month.
The Market
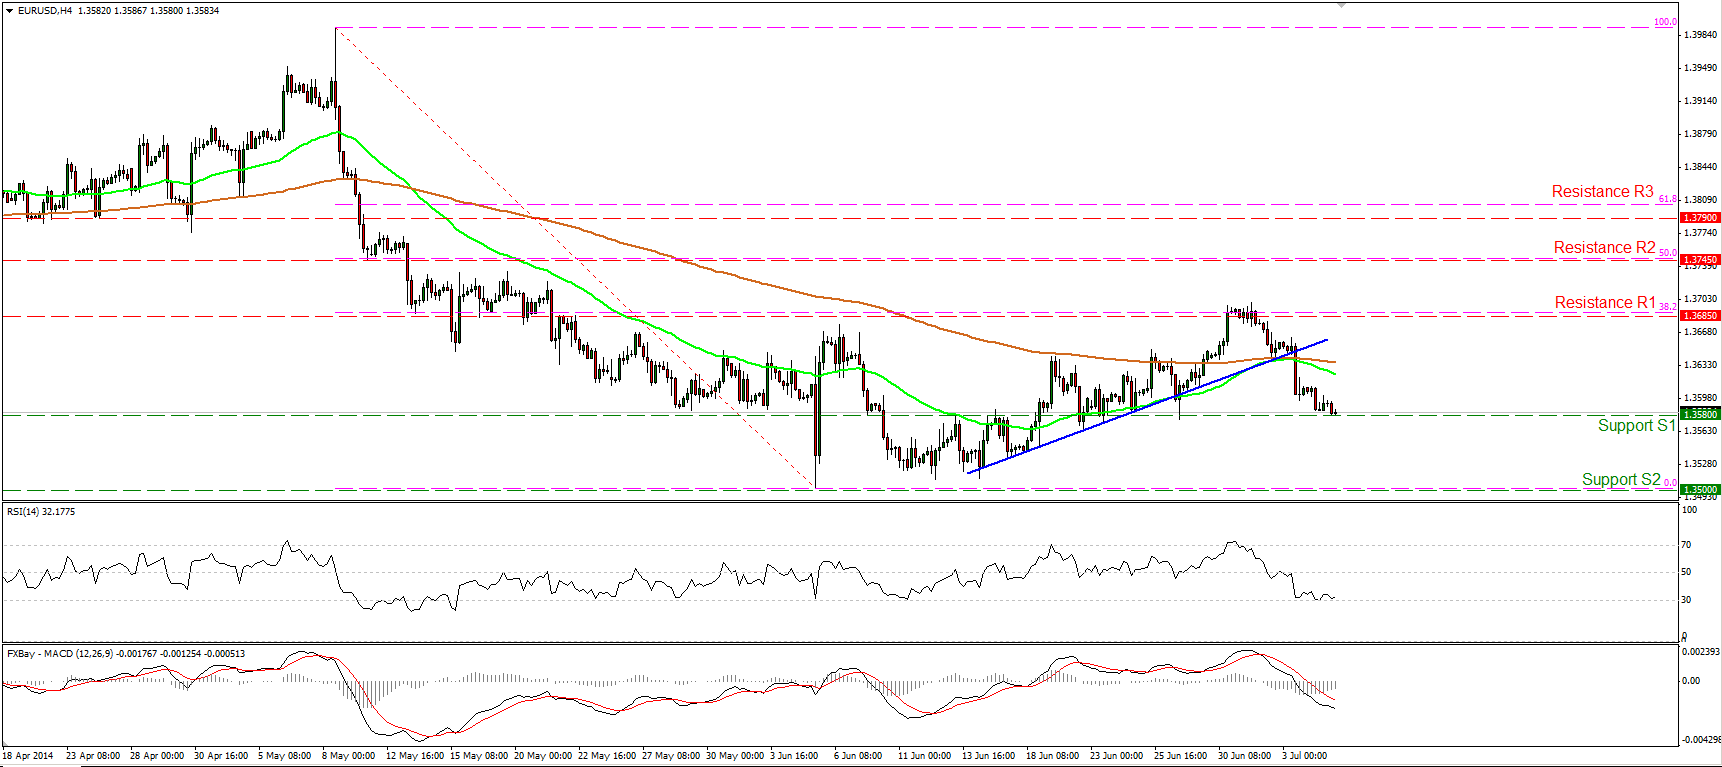
EUR/USD continues lower
The EUR/USD continued moving lower on Friday, but the decline was halted at 1.3580 (S1). A dip below that hurdle may signal that the recent advance was just a 38.2% retracement of the 8th May- 5th June decline, and could pave the way towards the key support of 1.3500 (S2). The MACD remains below both its trigger and zero lines, but the RSI retested its 30 level and moved slightly higher. As a result, I cannot rule out some consolidation or a bounce before the bears prevail again. In the bigger picture, the 14-day RSI fell below its 50 level, while the daily MACD, already in its negative territory, seems ready to cross below its trigger line. This amplifies the case of further declines in the near future.
• Support: 1.3580 (S1), 1.3500 (S2), 1.3475 (S3).
• Resistance: 1.3690 (R1), 1.3745 (R2), 1.3790 (R3).
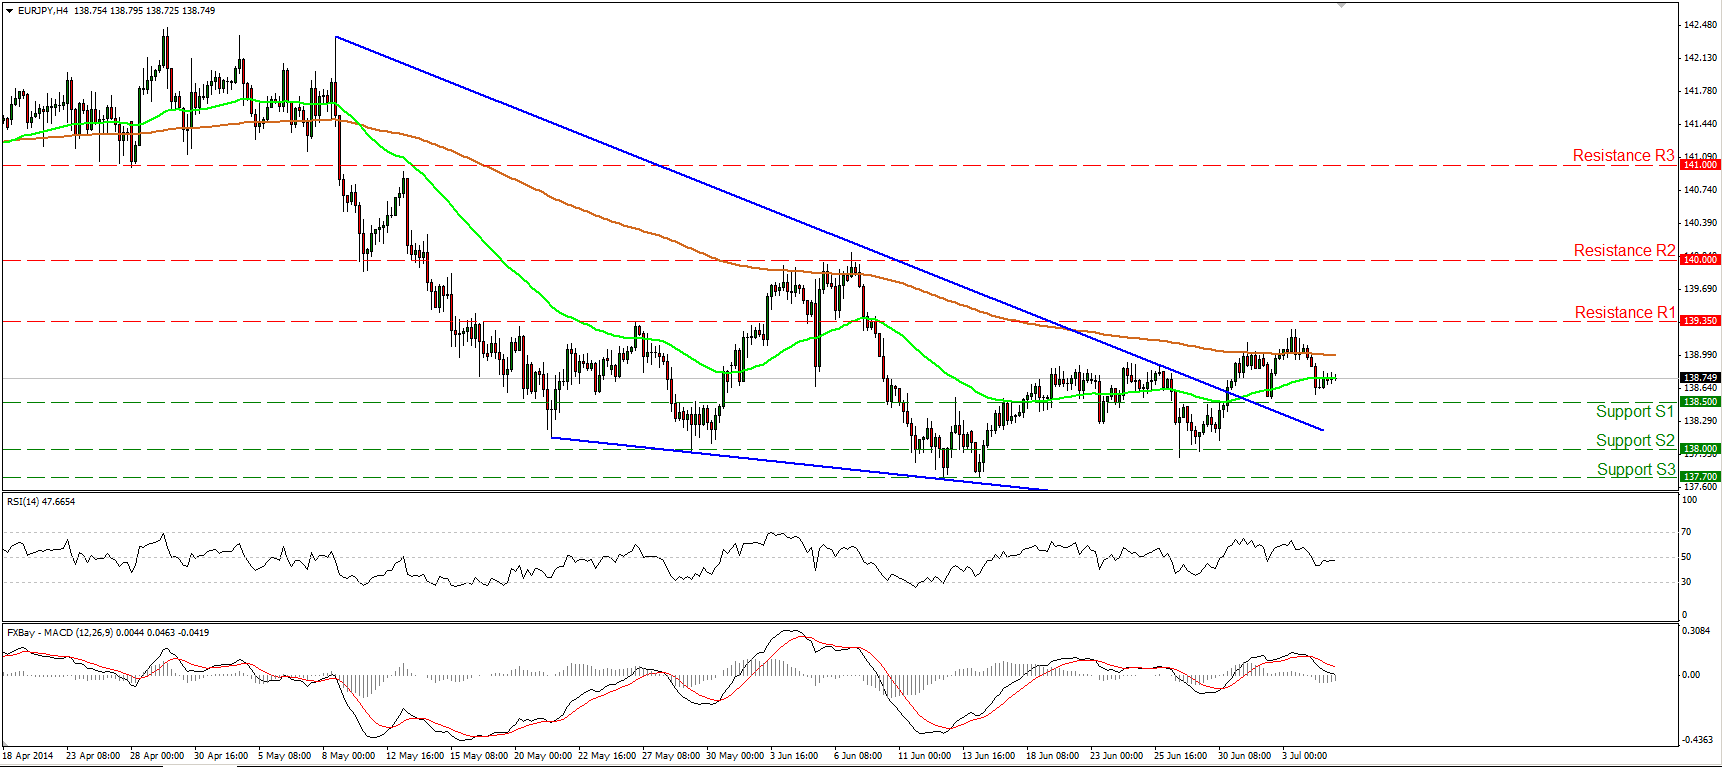
EUR/JPY turns neutral
The EUR/JPY tumbled after finding resistance slightly below the 139.35 (R1) barrier, but remained above the support of 138.50 (S1) and above the upper boundary of the falling wedge formation. The RSI lies below its 50 level while the MACD seems ready to challenge its zero line. Considering the mixed signs, I would adopt a neutral stance for now until we have clearer indications about the forthcoming directional movement of the rate. Moreover, both our moving averages are pointing sideways, confirming the neutral short-term outlook. In the bigger picture, the long-term path of the rate remains to the sideways since we cannot identify a clear trending structure.
• Support: 138.50 (S1), 138.00 (S2), 137.70 (S3).
• Resistance: 139.35 (R1), 140.00 (R2), 141.00 (R3).
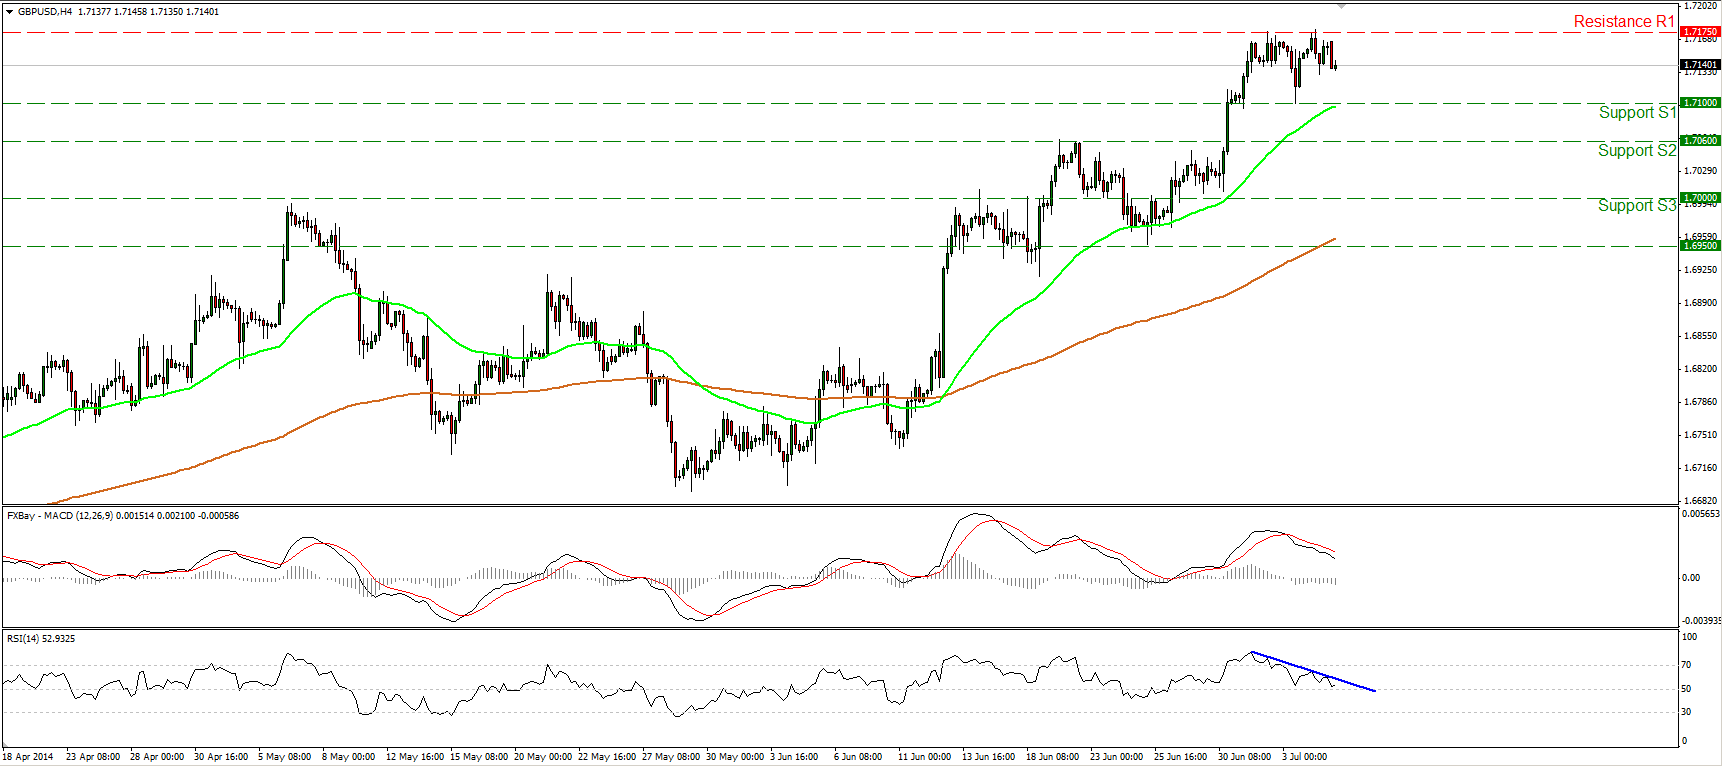
GBP/USD fails to overcome the 1.7175 barrier
The GBP/USD moved lower after failing to overcome the recent highs of 1.7175 (R1). The RSI continues trading below its blue resistance line and seems ready to challenge its 50 level, while the MACD, although in its positive zone remains below its signal line. On the daily chart, I can identify a hanging man and a spinning top, confirmed by Friday’s bearish candle. With all these signs, I cannot rule out the continuation or the decline. Nonetheless, the 80-day exponential moving average provides reliable support to the lows of the price action, keeping the long-term path to the upside. As a result, I would consider any future declines as correcting phase of the longer-term uptrend.
• Support: 1.7115 (S1), 1.7060 (S2), 1.7000 (S3).
• Resistance: 1.7175 (R1), 1.7200 (R2), 1.7300 (R3).
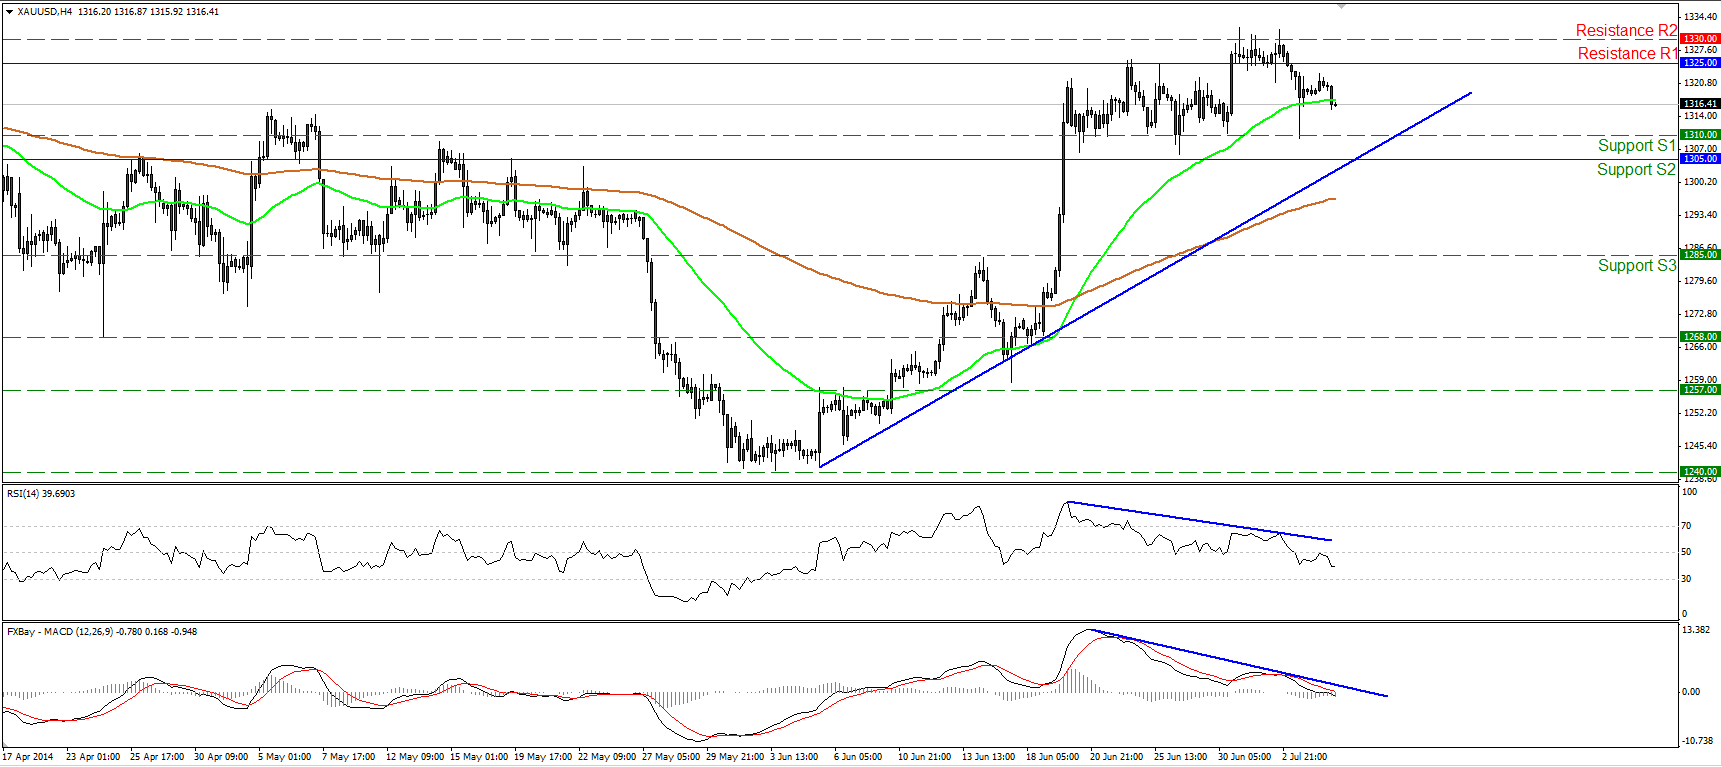
Gold still in a retracing mode
Gold moved slightly lower on Friday remaining near the 50-period moving average. Having in mind that both our momentum studies continued their downside paths, we may experience the continuation of the retracing wave, maybe for another test near the 1310 (S1) area. Nevertheless, as long as the precious metal is trading above the blue uptrend line, the overall technical picture remains positive and I would see any further declines as correcting phase, at least for now. Only a decisive move below the trend line and the support of 1305 (S2), could turn the short-term outlook negative, in my view.
• Support: 1310 (S1), 1305 (S2), 1285 (S3) .
• Resistance: 1325 (R1), 1330 (R2), 1342 (R3).
Is WTI ready for an upside corrective wave?
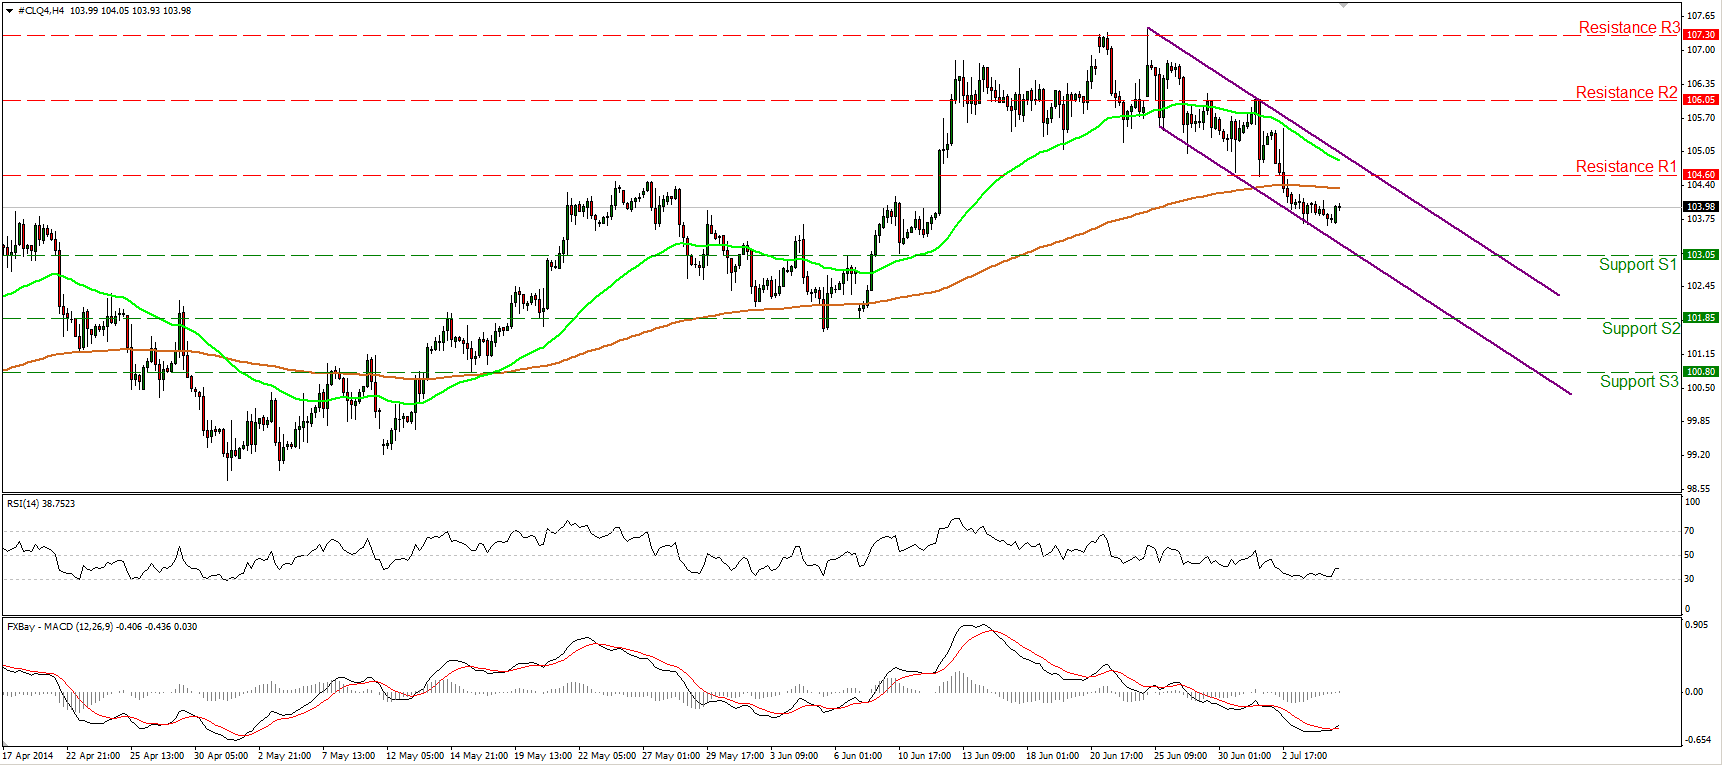
WTI edged slightly higher after leaving the lower boundary of the purple downward sloping channel. The MACD, although in its bearish territory, crossed above its signal line, while the RSI moved higher after finding support near its 30 level. Additionally, zooming in on the 1-hour chart, the positive divergence between our hourly momentum studies and the price action remains in effect. As a result, I would expect the upside corrective wave to continue. However, as long as WTI is printing lower highs and lower lows within the downward sloping channel, the short-term outlook remains to the downside. On the weekly chart, we can identify a bearish engulfing pattern, favoring the continuation of the short-term downtrend.
• Support: 103.05 (S1), 101.85 (S2), 100.80 (S3).
• Resistance: 104.60 (R1), 106.05 (R2), 107.35 (R3).

