Get 40% Off
These stocks are up over 10% post earnings. Did you spot the buying opportunity? Our AI did.Read how

EUR/GBP: Bear Flag Exit; USD/CAD Buyers Responding To Net Losses

Published 09/01/2014, 04:22 AM
Updated 07/09/2023, 06:31 AM

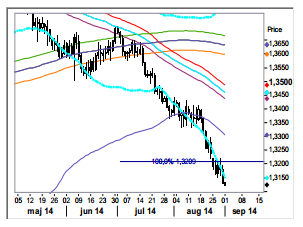
EUR/USD: Still offered.

With the Thursday/Friday bounce occurring in a clear three wave corrective manner a new trend low was confirmed breaking 1.3160. So far the 1.3117 support has prevented the pair from falling further but unless recovering above 1.3159 there’s still room for slightly lower levels (1.3094) before a new correction attempt likely will take place. On a longer term horizon the deviation from 1.3209 more and more speaks in favor of the next target being a 161.8% Fibo projection point at 1.2905.

EUR/USD Daily Chart

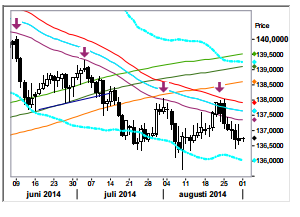
EUR/JPY: More losses confirmed underway.

With last week’s close below 136.82 a new utterly bearish weekly candle (bearish engulfing/bearish key week reversal) was created. The signal clearly warns of more losses in the month to come. In the shorter time frame also an hourly three wave rise from Thursday’s low points at an immediate downside risk (below 136.58 = break of 136.42).

EUR/JPY Daily Chart

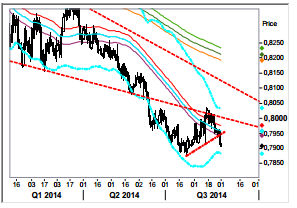
EUR/GBP: Bear flag exit.

The break and close below the 55d ma band and the bear flag ceiling has more or less confirmed the resumption of the underlying bear trend. Also the break below 0.7915, the low point of the impulsive Aug 13 rise, strongly argues for new trend lows in the making. Upside reactions should now be limited to the mid body point of Friday’s candle, 0.7930.

EUR/GBP Daily Chart

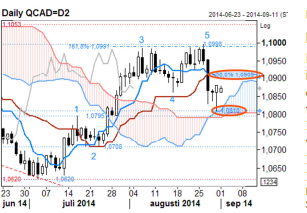
USD/CAD: Buyers at support!

Last week recorded net losses, that is true, but it is also very interesting to see how buyers responded to that move and did so at dynamic support. If/when resistance at 1.0910 is taken out, extension back to and above the Aug high of 1.0998 should be accounted for. Medium-term players would then open up for a test and break of a key ref at 1.1053. Current intraday stretches are located at 1.0830 & 1.0910.

3rd party Ad. Not an offer or recommendation by Investing.com. See disclosure here or remove ads .

USD/CAD Daily Chart

Original post

Latest comments

Risk Disclosure: Trading in financial instruments and/or cryptocurrencies involves high risks including the risk of losing some, or all, of your investment amount, and may not be suitable for all investors. Prices of cryptocurrencies are extremely volatile and may be affected by external factors such as financial, regulatory or political events. Trading on margin increases the financial risks.
Before deciding to trade in financial instrument or cryptocurrencies you should be fully informed of the risks and costs associated with trading the financial markets, carefully consider your investment objectives, level of experience, and risk appetite, and seek professional advice where needed.
Fusion Media would like to remind you that the data contained in this website is not necessarily real-time nor accurate. The data and prices on the website are not necessarily provided by any market or exchange, but may be provided by market makers, and so prices may not be accurate and may differ from the actual price at any given market, meaning prices are indicative and not appropriate for trading purposes. Fusion Media and any provider of the data contained in this website will not accept liability for any loss or damage as a result of your trading, or your reliance on the information contained within this website.
It is prohibited to use, store, reproduce, display, modify, transmit or distribute the data contained in this website without the explicit prior written permission of Fusion Media and/or the data provider. All intellectual property rights are reserved by the providers and/or the exchange providing the data contained in this website.
Fusion Media may be compensated by the advertisers that appear on the website, based on your interaction with the advertisements or advertisers.
© 2007-2024 - Fusion Media Limited. All Rights Reserved.