Get 40% Off
💰 Buffett reveals a $6.7B stake in Chubb. Copy the full portfolio for FREE with InvestingPro’s Stock Ideas toolCopy Portfolio

ETF Tracks Individual Country Growth

Published 05/17/2012, 07:49 AM
Updated 05/14/2017, 06:45 AM
AWRE
-
PP4A
-
IFNC
-

Guggenheim BRIC ETF (EEB) has combined four single-country markets into one handy ETF. It has become popular for those perhaps unable to buy all four individual country funds or for those that find it more difficult to cherry-pick one or two for inclusion in their portfolios.

Brazil, Russia, India and China have been the power houses of new economic growth among developing markets. It would be difficult to consider these countries as “emerging markets” since, for example, China is now the world’s third largest economy.

At the same time it’s impossible for these high growing economies to avoid the pitfalls of any market. These often include inflation issues. Both Brazil and India, for example, are battling high, single-digit inflation and are wrestling with ways to tame it that can negatively impact equity-market appreciation.

China also has had inflation issues, which it has tried to contain but recently has given more accommodation by lowering bank-reserve requirements to stimulate more economic growth. Russian markets are very much tied to volatility, descending commodity markets and recent political instability. So investing in these markets hasn’t been very rewarding in 2012, as most of them have fallen 20%-30% from recent highs in March.

Assembling (EEB) takes some ingenuity as it’s far from equally balanced in country allocation as noted below, as of March 31:

  • Brazil             54.56 %
  • China            18.46 %
  • HongKong   13.61 %
  • India              11.23 %
  • Russia             2.15 %

This imbalance is primarily due to market-capitalization issues and relative market depth. But potential investors should be aware of specific country allocation and not assume that the constituent countries are evenly allocated.
 
Top fund sector exposure for EEB is below, as of March 31:

3rd party Ad. Not an offer or recommendation by Investing.com. See disclosure here or remove ads .
  • Energy                                                25.28 %
  • Financials                                          16.81 %
  • Telecommunication Services           14.57 %
  • Materials                                             14.28 %
  • Information Technology                      9.42 %
  • Consumer Staples                               8.94 %
  • Consumer Discretionary                     3.94 %
  • Utilities                                                  3.75 %
  • Industrials                                             1.65 %
  • Health Care                                           1.37 %

Below is a monthly chart of (EEB). Annotations within the chart include general advice for most investors to remain on the right side of the 12-period moving average (MA).
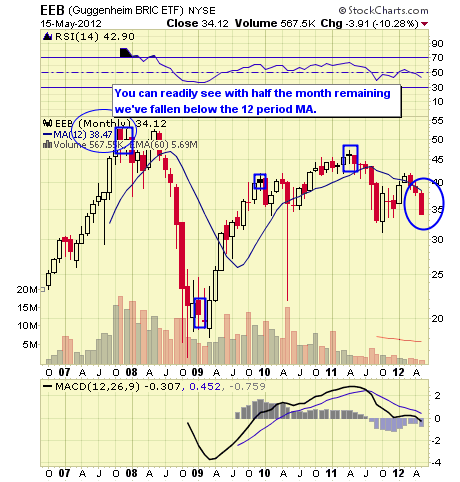
EEB CHART
disclosure : The ETF Digest has no current position in EEB.

Latest comments

Wow this is a good one. After shorting heavy on GREK. Im searching for the next salmon and India & brazil are next of my list. I was thinking of buying PUTS for EPI (India ETF) but EEB will be give me good exposure in all BRICS. Thank you for this post.
Risk Disclosure: Trading in financial instruments and/or cryptocurrencies involves high risks including the risk of losing some, or all, of your investment amount, and may not be suitable for all investors. Prices of cryptocurrencies are extremely volatile and may be affected by external factors such as financial, regulatory or political events. Trading on margin increases the financial risks.
Before deciding to trade in financial instrument or cryptocurrencies you should be fully informed of the risks and costs associated with trading the financial markets, carefully consider your investment objectives, level of experience, and risk appetite, and seek professional advice where needed.
Fusion Media would like to remind you that the data contained in this website is not necessarily real-time nor accurate. The data and prices on the website are not necessarily provided by any market or exchange, but may be provided by market makers, and so prices may not be accurate and may differ from the actual price at any given market, meaning prices are indicative and not appropriate for trading purposes. Fusion Media and any provider of the data contained in this website will not accept liability for any loss or damage as a result of your trading, or your reliance on the information contained within this website.
It is prohibited to use, store, reproduce, display, modify, transmit or distribute the data contained in this website without the explicit prior written permission of Fusion Media and/or the data provider. All intellectual property rights are reserved by the providers and/or the exchange providing the data contained in this website.
Fusion Media may be compensated by the advertisers that appear on the website, based on your interaction with the advertisements or advertisers.
© 2007-2024 - Fusion Media Limited. All Rights Reserved.