🎁 💸 Warren Buffett's Top Picks Are Up +49.1%. Copy Them to Your Watchlist – For FreeCopy Portfolio

ETF Sector Review: Utilities In The Lead

Published 01/08/2015, 07:29 AM
Updated 07/09/2023, 06:31 AM
US500
-
SPY
-
VOX
-
XLE
-
XLV
-
XLU
-

Utility sector stocks don’t usually excite the crowd, but this corner of the U.S. equity market has shed its dull image lately. Traditionally seen as a safe haven within the broad market, shares of electric and gas utility companies are performing like growth stocks these days.

Thanks to the renewed risk-off bias of late, utilities are comfortably in the lead among the U.S. equity sectors, based on a set of ETFs via trailing one-year total returns through yesterday (Jan.7).

The Utilities Select Sector SPDR (NYSE:XLU) is up nearly 31% over the past 252 trading days—a sizable edge over the number two performer, Health Care Select Sector SPDR (ARCA:XLV), which is ahead by 26%.

As for the red ink club, energy is still its leading member for the trailing one-year period. The Energy Select Sector SPDR (ARCA:XLE) is down by roughly 12% over the past year. But energy’s misery now has company: the performance for telecom stocks recently slipped below zero for the trailing 252-day period, albeit ever so slightly.

Vanguard Telecommunication Services (NYSE:VOX) through yesterday was down by a few basis points relative to its year-earlier price. As for the market overall, the S&P 500 is ahead by roughly 12% for the trailing one-year period, based on the SPDR S&P 500 (ARCA:SPY) on a total return basis (red line in chart below).
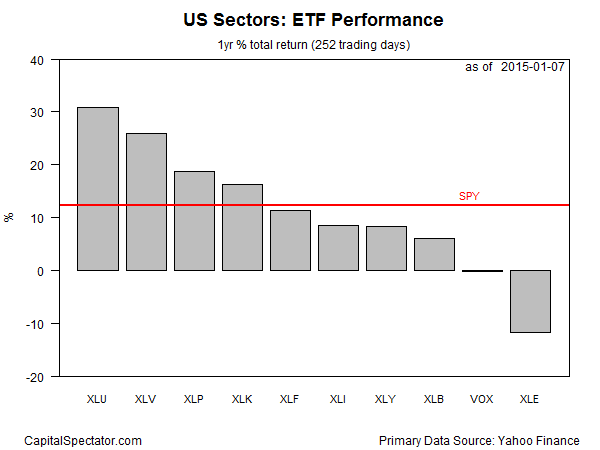
U.S. Sectors: ETF Performance As of January 7, 2015

Here’s how the trailing one-year performance histories stack up when we index all the sector ETFs to 100 as of Jan. 8, 2014. Note the recent acceleration in utilities (black line at top). Meanwhile, the recent rally in energy stocks has succumbed once again to bearish sentiment (purple line at bottom).
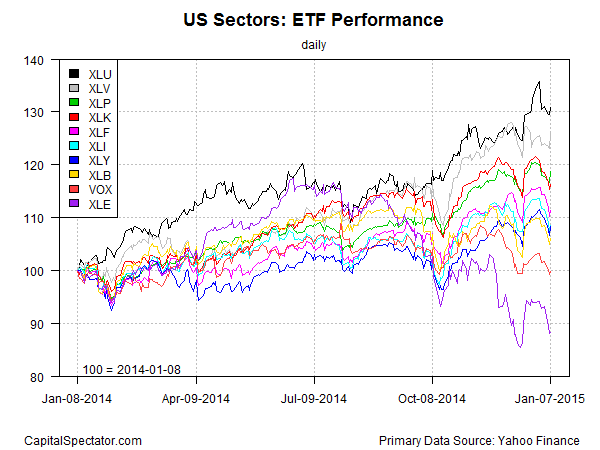
US Sectors:ETF Performance Daily From Jan. 8, 2014 To Jan. 7, 2015

Finally, here’s a comparison of recent momentum for the sector ETFs via current prices relative to trailing 50- and 200-day moving averages, as shown in the next chart below. For example, Energy Select Sector SPDR ETF (ARCA:XLE) closed yesterday at 8% below its 50-day moving average (red square in lower right-hand corner) and nearly 17% below its 200-day moving average (black square in lower right-hand corner).
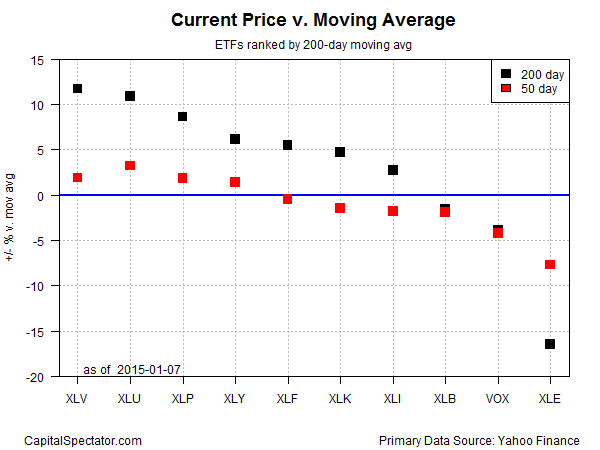
ETFs Ranked by 200 and 50 Day Moving Averages

Latest comments

Loading next article…
Risk Disclosure: Trading in financial instruments and/or cryptocurrencies involves high risks including the risk of losing some, or all, of your investment amount, and may not be suitable for all investors. Prices of cryptocurrencies are extremely volatile and may be affected by external factors such as financial, regulatory or political events. Trading on margin increases the financial risks.
Before deciding to trade in financial instrument or cryptocurrencies you should be fully informed of the risks and costs associated with trading the financial markets, carefully consider your investment objectives, level of experience, and risk appetite, and seek professional advice where needed.
Fusion Media would like to remind you that the data contained in this website is not necessarily real-time nor accurate. The data and prices on the website are not necessarily provided by any market or exchange, but may be provided by market makers, and so prices may not be accurate and may differ from the actual price at any given market, meaning prices are indicative and not appropriate for trading purposes. Fusion Media and any provider of the data contained in this website will not accept liability for any loss or damage as a result of your trading, or your reliance on the information contained within this website.
It is prohibited to use, store, reproduce, display, modify, transmit or distribute the data contained in this website without the explicit prior written permission of Fusion Media and/or the data provider. All intellectual property rights are reserved by the providers and/or the exchange providing the data contained in this website.
Fusion Media may be compensated by the advertisers that appear on the website, based on your interaction with the advertisements or advertisers.
© 2007-2024 - Fusion Media Limited. All Rights Reserved.