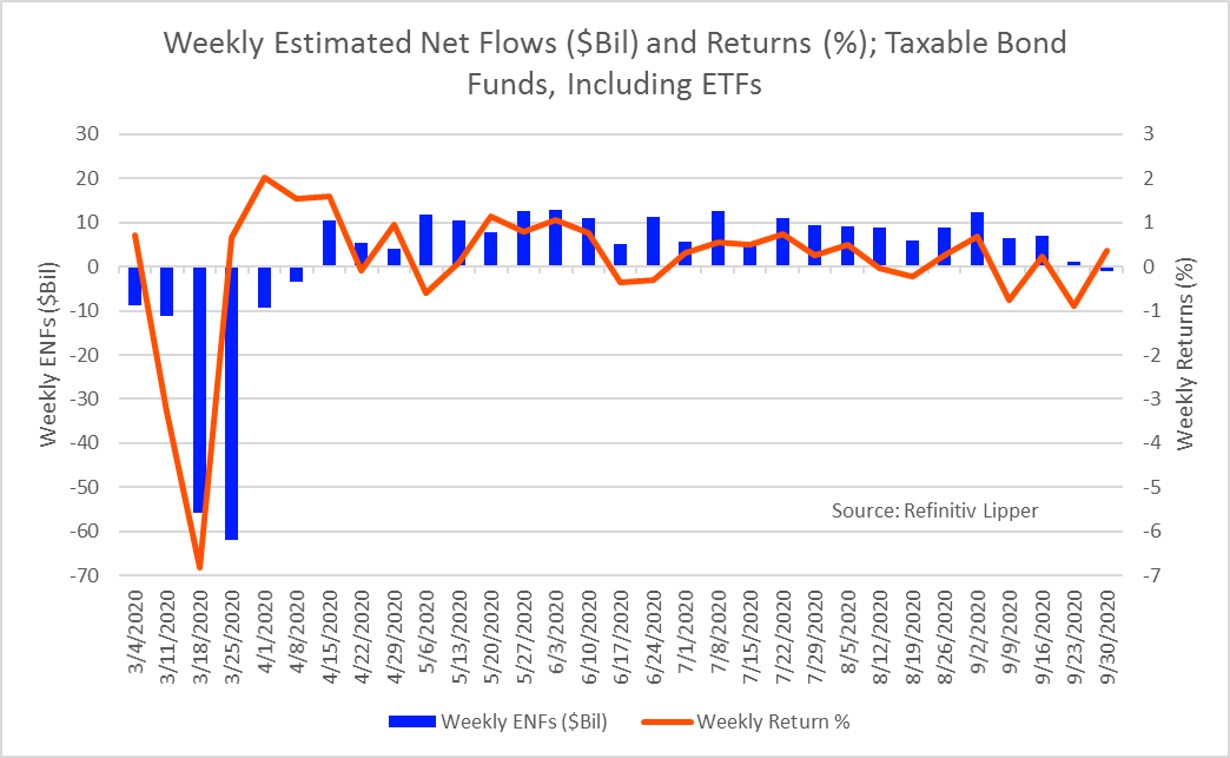
Bond funds (including ETFs) witnessed their first week of net outflows in 25 for the Refinitiv Lipper fund-flows week ended September 30, 2020, handing back a net $1.1 billion. While investors continued to inject net new money into corporate investment-grade debt funds (+$2.1 billion), they were net redeemers of corporate high yield funds (-$3.6 billion) and flexible funds (-$808 million).

With the U.S. equity market witnessing declines over the preceding few weeks, it’s not too surprising to see equity funds and high yield bond funds suffer net redemptions. However, equity funds only handed back a net $32 million for the fund-flows week (for their seventh consecutive week of net outflows), with conventional equity funds suffering net redemptions of $5.024 billion and equity ETFs attracting some $4.992 billion. For the fund-flows week, the average equity fund returned a handsome 3.17%.
However, in the high yield funds space, both conventional high yield funds (-$2.5 billion) and high yield ETFs (-$1.1 billion) witnessed net redemptions as concerns over credit quality, soft economic data, and a call by the Federal Reserve Board for an additional round of Congressional stimulus have some investors beginning to shun risky assets despite the average high yield fund posting a weekly return of 0.37%. For the fund-flows week, iShares iBoxx $ High Yield Corporate ETFs (NYSE:HYG) suffered the largest net outflows in the taxable fixed income universe, handing back a net $1.2 billion, while iShares 20+ Year Treasury Bond ETF (NASDAQ:TLT) ($426 million) was the main attractor of investors’ money.
Year to date through the week ended September 30, corporate investment-grade debt funds (including ETFs) have attracted the largest share of investors assets (+$154.7 billion), while corporate high yield funds (+$34.8 billion), government Treasury & mortgage funds (+$22.9 billion), and government Treasury funds (+$15.5 billion) were the runners up as investors were split in their search for yield and flight to safety.
Exchange-traded funds have been the primary attractors of investors’ assets in 2020 thus far. For the year-to-date period, conventional taxable bond and equity funds have attracted and handed back $19.2 billion and $357.7 billion, respectively, while their ETF counterparts have taken in $141.9 billion and $88.5 billion.
