At its H119 results, ERM Power Ltd (AX:EPW) sent a strong positive signal about the outlook for its Electricity Retail business, upgrading its medium-term gross margins per unit by c 10%. The c 30% dividend hike, the additional 3c/share special dividend and A$60m reserved for investments in growth also show the balance sheet and the cash flow are strong.
Strong cash flow supports dividends and capex
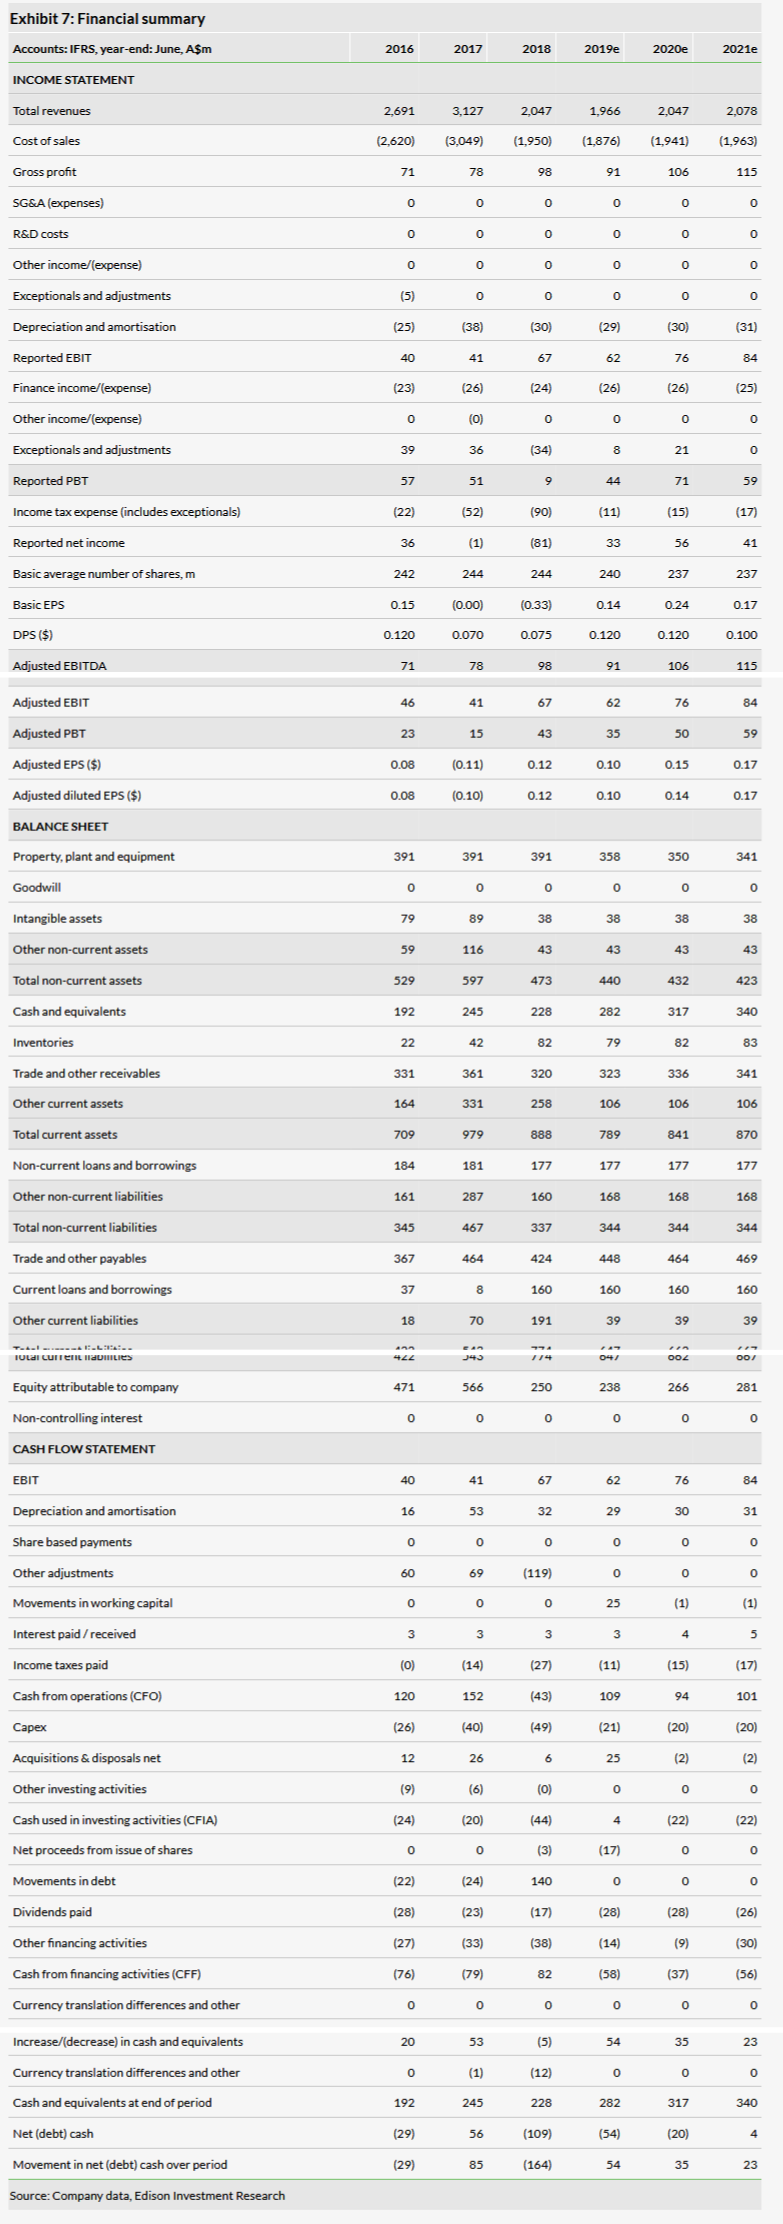
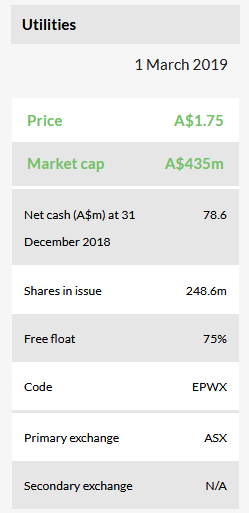
At H1 results, ERM Power announced a c 30% FY19 dividend hike, an additional 3c/share special dividend for FY19 (another will be considered for FY20) and that A$60m is reserved for growth investments. We believe this shows the balance sheet (post US disposal) and cash-flow generation are strong and the company is confident in its outlook. We estimate total A$190m free cash flow for FY19–22 (before growth capex and in addition to US disposal proceeds of A$37m), equivalent to 44% of the market cap. We expect cash flow to be used for shareholder remuneration and growth initiatives. We estimate total dividends and a share buyback of A$99m, equivalent to 23% of the current market cap.
Retail outlook upgraded, Energy Solutions reduced
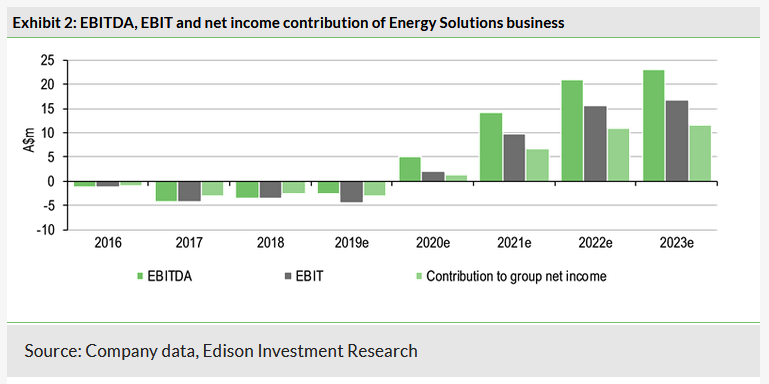
From a business point of view, the key highlight is the upgrade in the medium-term guidance for the Electricity Retail business. The unit gross margin guidance has been upgraded by c 10% and the retail business reached record margins at H119 results. ERM Power has broadly confirmed the outlook for FY19 results, with the exception of Energy Solutions, for which EBITDA guidance of a A$2.5m loss was confirmed despite the recent acquisition of Out Performers (A$2m EBITDA contribution). While we view this as a small disappointment, we still believe the medium-term growth potential for Energy Solutions is significant and estimate it could contribute to 21% growth in group EBITDA in a mid-case scenario. We have reduced FY19 net income by 10%, mainly to reflect the lower contribution from Energy Solutions, but have made small changes from FY20 as this impact is partly offset by higher Electricity Retail EBITDA.
Valuation: Metrics undemanding
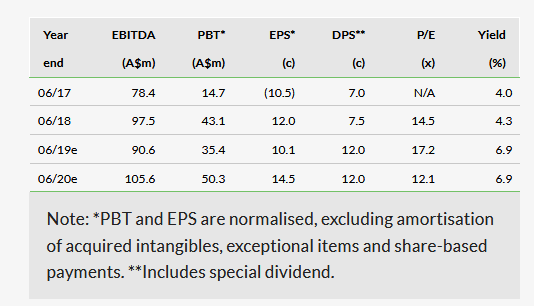
Despite the strong positive share price reaction to H1 results, earnings and cash flow-based valuation metrics still appear undemanding compared with Australian small caps. The stock trades at c 10–12x P/E in FY20–FY21 (excluding a one-off contribution from the LGC sale) and the dividend yield is attractive at 6.9% for FY19 including the special dividend (5.1% based on the ordinary dividend only), especially considering the robust FCF yield (17% in FY19). Our base-case valuation is unchanged at A$2.4/share, assuming no value for Energy Solutions.
Business description
ERM Power is an Australian commercial and industrial energy retailer and trader founded in 1980 and listed in 2010. It operates an electricity supply business (second-largest retailer to C&I customers) and two gas-fired generation plants. A key area of growth is energy solutions. The company recently sold its US business.
30% DPS hike; special dividend; higher supply outlook
The key highlights of the H1 results were the c 30% dividend hike (from 7c to 9c), the introduction of an additional special dividend of 3c/share for FY19 (an additional special dividend will be considered for FY20, with an update at H120 results), A$60m reserved for growth investments, a c 10% higher medium-term outlook for margins per MWh for its core Electricity Retail business (from a range of A$4.00–5.50/MWh to A$4.50–6.00/MWh). On the negative side, the FY19 outlook for the Energy Solutions business was revised down.
H1 results down y-o-y and strong cash flow
H1 EBITDA was down 5% y-o-y to A$47.3m, reflecting lower power-generation business profits and slightly higher corporate costs. The EBITDA decline drove a 13% y-o-y decline in underlying net income. The FY19 outlook for the various divisions was broadly confirmed, with the exception of Energy Solutions.
ERM Power generated very strong cash flow as a result of its ordinary business, the sale of the US business for A$37m and a positive variation margin of its derivatives position (+A$147.5m). It reported net cash of A$78.6m at 31 December 2018 (vs net debt of A$108.7m at 30 June 2018). As the value of its derivatives position varies significantly depending on the evolution of wholesale electricity prices (when electricity prices increase, the company receives a cash inflow, whereas a cash outflow takes place when wholesale prices reduce) and it is difficult to predict, we assume the cash inflow from the variation margin the company benefited from in H1 mostly reverses by the end of FY19.
Electricity Retail margin at record levels; medium-term guidance mid-point implies further rise
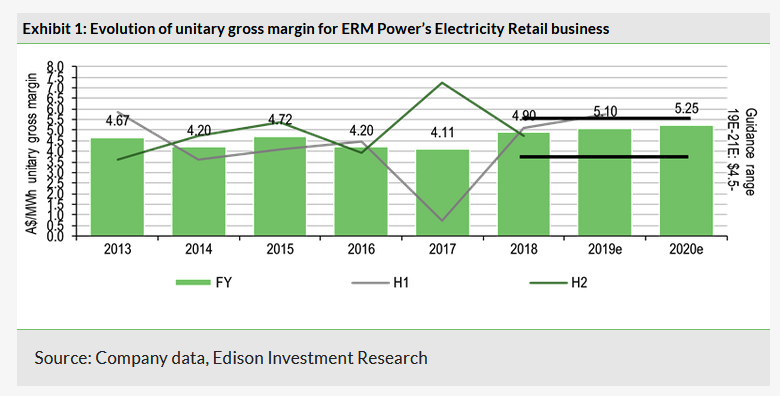
The FY19 outlook for power generation was confirmed and the outlook for the Electricity Retail business was broadly consistent with previous announcements as the impact of slightly lower volumes (from 19TWh to 18TWh) was more than offset by higher than expected unit margins (from A$4.75/MWh to A$5.1/MWh). We highlight the level by ERM Power for FY19 is the highest margin the company has achieved in several years (Exhibit 1) and the mid-point of the A$4.5–6.0/MWh targeted range for the medium-term implies a further increase.
Energy Solutions FY19 outlook downgraded; growth potential remains very strong
The outlook for organic growth in the Energy Solutions business was instead downgraded. ERM Power retains its FY19 guidance for A$2.5m EBITDA loss, however, with the expected c A$2m FY EBITDA contribution from recently acquired Out Performers. ERM Power explained there have been some delays for certain major tenders and that the sales cycle was longer than it originally anticipated. ERM Power said it expects an improvement in H2 FY19 and confirmed the FY20 target of positive net income contribution.
Source: Company data, Edison Investment Research
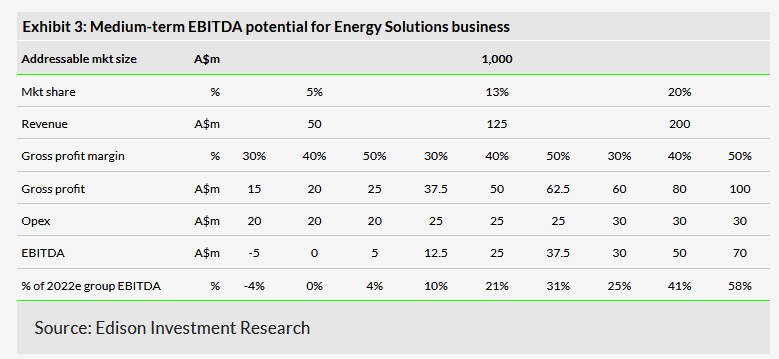
Exhibit 3 shows an updated analysis of the medium-term potential for the Energy Solutions business (see US update and focus on energy solutions, June 2018). We estimate the development of the business could drive significant growth with 21% growth in group EBITDA in a mid-case scenario (12.5% market share and 40% gross profit margin).
Strong cash flow supports dividends and growth capex
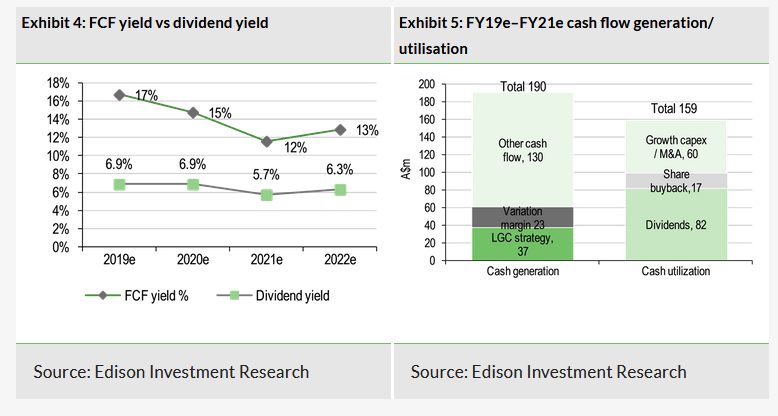
Over the next three years we estimate ERM Power will generate strong cash flow, driven by healthy margins in the supply and power-generation activities, one-off cash inflow from the sale of its portfolio of large-scale generation certificates (LGC) and a small positive variation margin from its derivatives position (absolute position was marginally negative at the end of FY18 results, hence we assumed a cash inflow to reach zero). We estimate total A$190m free cash flow in FY19–22, before M&A and growth capex, equivalent to 44% of the current market cap. On top of this cash flow generation, A$37m has been raised with the disposal of the US business. We expect this cash flow will be used in a balanced way for shareholder remuneration and growth initiatives. We estimate total dividends and share buyback over the period of A$99m, equivalent to 23% of the current market cap (assuming a special dividend in FY20 and growth in ordinary dividends thereafter). On our estimates, the free cash flow yield will easily cover the high dividend yield (Exhibit 4). In addition, the company has announced that A$60m has been reserved for growth initiatives (not included into our forecasts) – we expect this will be used mainly for acquisitions by the Energy Solutions business. As shown in Exhibit 5, the cash flow generation we forecast is higher than expected cash flow utilisation, which leaves more room for dividends and/or growth capex, also considering the strong financial structure of the company (net cash at H119).
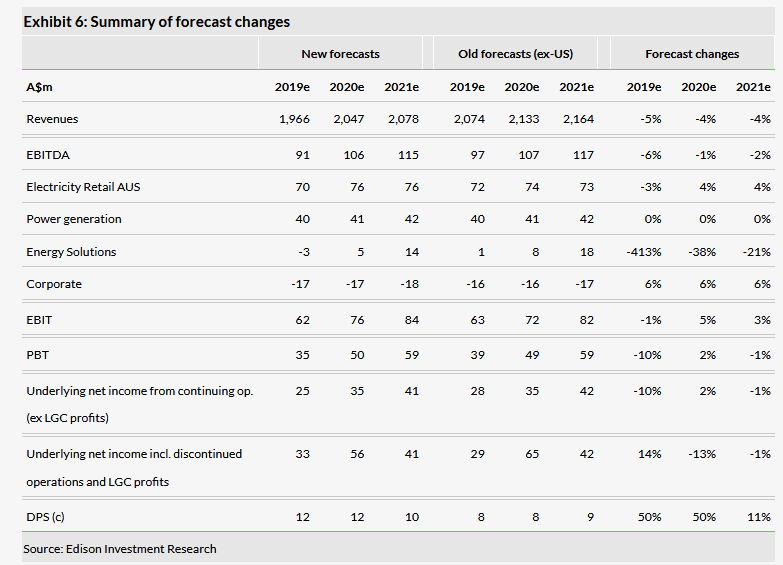
Forecast changes: FY19 reduced, few changes for following years
We have reduced FY19 underlying net income by 10% reflecting lower EBITDA (mainly due to Energy Solutions) and higher financial expenses and despite lower D&A. We have made few changes to FY20/FY21 underlying net income as the slightly higher contribution from Electricity Retail is more than offset by Energy Solutions. We continue to expect a significantly positive impact on net income of the LGC sale (A$16m in FY19 and A$21m in FY20, according to company guidance), taking into account discontinued operations (loss of A$7.7m in FY19). We have increased the DPS substantially to reflect the 30% dividend hike for FY19 and the special dividend.
Valuation: Attractive earnings and cash flow-based metrics
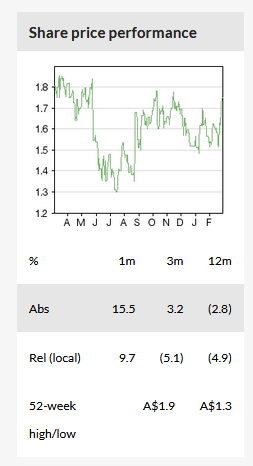
Despite the strong positive share price reaction to H1 results (including +7% on the day), earnings and cash flow-based valuation metrics still appear undemanding compared with Australian small caps. The stock trades at c 10–12x P/E in FY20–FY21 (excluding a one-off contribution from the LGC sale) and the dividend yield is also attractive at 6.9% if FY19 includes the special dividend (5.1% based on ordinary dividend only), especially considering the robust FCF yield (17% in FY19).
Excluding Energy Solutions (loss making and generating negative cash flow), our base case valuation is unchanged at A$2.4/share. This is based on a DCF-based SOTP valuation with 11% WACC and the valuation is unchanged as our long-term forecasts are broadly maintained. Including a valuation for the Energy Solutions business, which has not yet reached break-even but has strong growth prospects in our view, would increase the SOTP valuation to A$2.8/share based on a multiples valuation (down from $3.0/share previously as a result of lower forecasts for this business). Key risks to our valuation and investment case are higher/lower supply and power-generation margins in Australia and higher/lower growth in Energy Solutions.
