Get 40% Off
🚨 Volatile Markets? Find Hidden Gems for Serious Outperformance
Find Stocks Now

Equity Performance: U.S. Vs. Europe Vs. Japan

Published 10/30/2014, 12:24 PM
Updated 07/09/2023, 06:31 AM

This Great Graphic, created on Bloomberg, reflects the performance of three major indices since the start of the year.  The white line is the U.S. S&P 500.  It has clearly outperformed the Dow Jones Stoxx 600 (yellow line) and the Nikkei (green line).
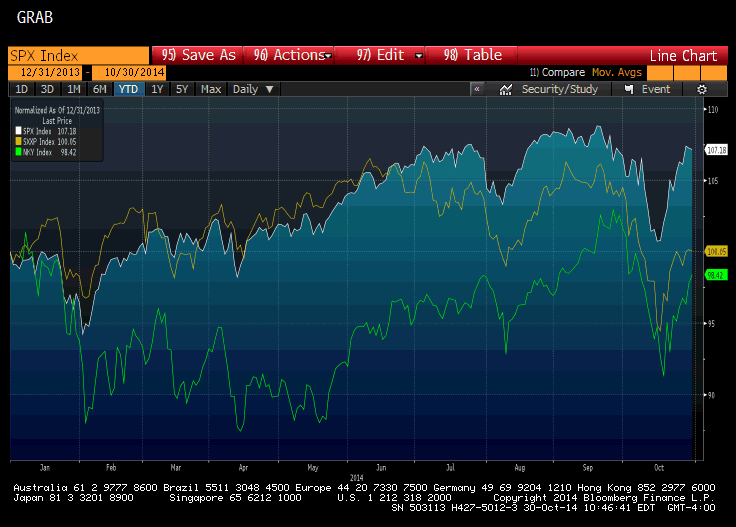
S&P 500, Dow Jones Stoxx 600 And The Nikkei

Specifically, year-to-date the S&P 500 has risen 7.2%, the Nikkei has fallen 3.9% while the Dow Jones Stoxx 600 is essentially flat.   As the chart depicts, the S&P 500 recovery off the mid-October lows has been more extensive than the other two indices.
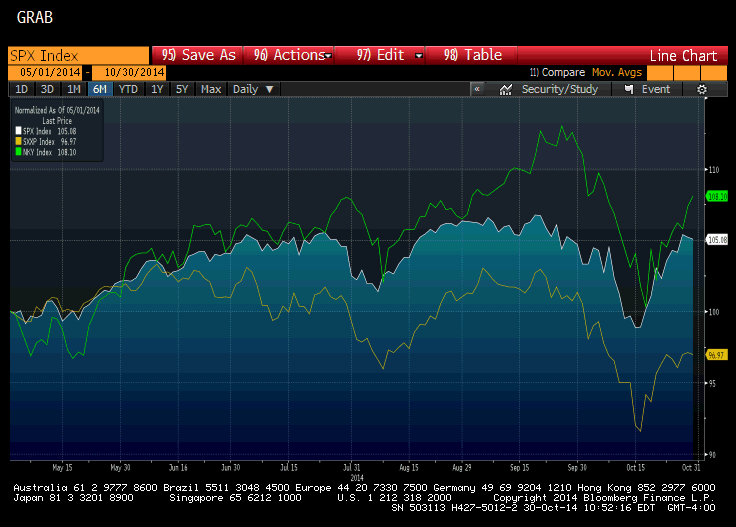
The Nikkei Trumps The Others

However, as the chart above reveals that over the past six months, the Nikkei has beaten the S&P 500 quite handily -- 9.5% to 5.2%.  The Dow Jones Stoxx 600 has fallen almost 2.9%.  Foreign investors took some profits on Japanese shares at the start of the year, but have been net buyers over the past six months, according to the weekly MOF data. The average weekly purchase has been almost JPY44 bln (~$400 mln), which seems too small to explain much of the rise in the Nikkei.  

The yen has depreciated 6.2% over the past three months and 3.4% year-to-date.   However, the actual inverse correlation between the Nikkei and the yen is low.   On a percentage change basis, the rolling correlation over the past sixty sessions is less than 0.1. Conducted at the level of differences, the average correlation over the past sixty days was  a little more than 0.1.  Still, if one thinks the Nikkei may weaken, there is disappointment with the BoJ (or the slew of tomorrow's economic data), it still seems reasonable to suspect that the dollar may run out of steam after reaching its best level since October 6.

3rd party Ad. Not an offer or recommendation by Investing.com. See disclosure here or remove ads .

Original Post

Latest comments

Risk Disclosure: Trading in financial instruments and/or cryptocurrencies involves high risks including the risk of losing some, or all, of your investment amount, and may not be suitable for all investors. Prices of cryptocurrencies are extremely volatile and may be affected by external factors such as financial, regulatory or political events. Trading on margin increases the financial risks.
Before deciding to trade in financial instrument or cryptocurrencies you should be fully informed of the risks and costs associated with trading the financial markets, carefully consider your investment objectives, level of experience, and risk appetite, and seek professional advice where needed.
Fusion Media would like to remind you that the data contained in this website is not necessarily real-time nor accurate. The data and prices on the website are not necessarily provided by any market or exchange, but may be provided by market makers, and so prices may not be accurate and may differ from the actual price at any given market, meaning prices are indicative and not appropriate for trading purposes. Fusion Media and any provider of the data contained in this website will not accept liability for any loss or damage as a result of your trading, or your reliance on the information contained within this website.
It is prohibited to use, store, reproduce, display, modify, transmit or distribute the data contained in this website without the explicit prior written permission of Fusion Media and/or the data provider. All intellectual property rights are reserved by the providers and/or the exchange providing the data contained in this website.
Fusion Media may be compensated by the advertisers that appear on the website, based on your interaction with the advertisements or advertisers.
© 2007-2024 - Fusion Media Limited. All Rights Reserved.