There has been much written lately about market divergences. Jeff Miller, who I depend on for a level-headed view of macro and fundamental insights, this week rhetorically asked the following question:
Here is a simple test:
When these more speculative stocks were surging last year, did analysts now warning about "divergences" celebrate the "confirmation" of the strength of the market? Or did they warn that the market was in a "bubble?"
If the latter, isn't it healthy to restore more normal valuations?
Brett Steenbarger at TraderFeed looked back at past instances of negative breadth divergencess when the broad market averages were making new highs. What he found surprised him:
Specifically, I went back to the start of 1990 and looked at all occasions in which the SP 500 Index closed within 2% of its 200-day high under the following conditions: a) VIX less than 15; b) new 52-week highs under 100; and c) new 52-week lows over 50...
Indeed, looking across the 38 occasions, the next 20 trading sessions averaged a gain of 1.9% and the next 50 sessions averaged a gain of 3.51%, with only a handful of losing instances in each case.
He concluded:
Now, my conclusion is not to jump in with both hands and buy this market. Rather, the data exercise has accomplished two things: 1) tempered my bearish leaning; and 2) illuminated the kind of market we are in.
I find this to be true of data exercises in general. They offer a kind of perspective that checks assumptions and biases and can trigger new ideas as well. The historical perspective is not always the correct perspective, but it often is a fresh one--and there is value in examining one's assumptions critically.
A risk-off environment
I would agree with Steenbarger. My own view of breadth indicators is that while they can provide warnings of negative environments for stocks, they are not precise timing indicators. I showed that the corrections of 2011 and 2012 were not accompanied by breadth deterioration in the Advance-Decline Line (see Should you sell in May?).
My cautiousness about the stock market is related to broad based indications of the loss of risk appetite across the board (see The bearish verdict from market cycle analysis). However, I do agree with the evidence based approach used by Steenbarger to test his conjectures about markets.
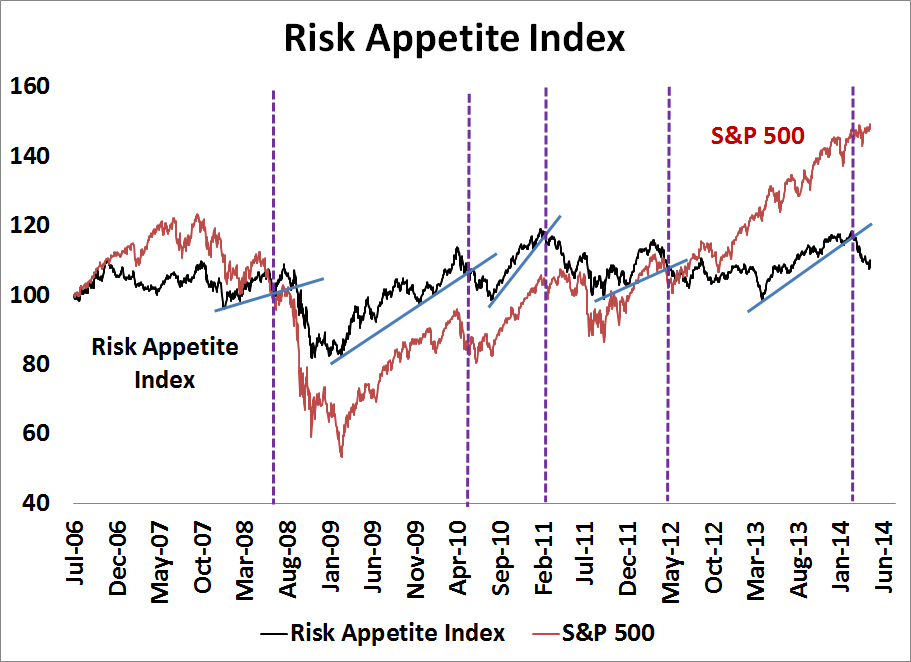
In that spirit, I have constructed a Risk Appetite Index, consisting of an equal weighted long position in the high-beta segments of the market, namely the Russel 2000 (iShares Russell 2000 Index (ARCA:IWM)) and Nasdaq 100 (PowerShares QQQ (NASDAQ:QQQ)), coupled with an equal weighted short position in defensive sectors of Consumer Staples (SPDR - Consumer Staples (ARCA:XLP)), Utilities (SPDR Select Sector - Utilities (NYSE:XLU)) and Telecom (iShares DJ Transport Average Index (ARCA:IYT)).
The chart below shows the Risk Appetite Index (in black) and the S&P 500 (in red):

There were four past instances of trend breaks in the Risk Appetite Index, where the breaks were marked by the dotted purple lines. In three of those instances (2008, 2011 and 2012), stock prices either entered a bear market (2008) or corrected (2011 and 2012). On one occasion (2010), stocks failed to decline, but that can be partly explained by the fact that they had already corrected.
None of the information or opinions expressed in this blog constitutes a solicitation for the purchase or sale of any security or other instrument. Nothing in this blog constitutes investment advice and any recommendations that may be contained herein have not been based upon a consideration of the investment objectives, financial situation or particular needs of any specific recipient. Any purchase or sale activity in any securities or other instrument should be based upon your own analysis and conclusions. Past performance is not indicative of future results. Either Qwest or I may hold or control long or short positions in the securities or instruments mentioned.
