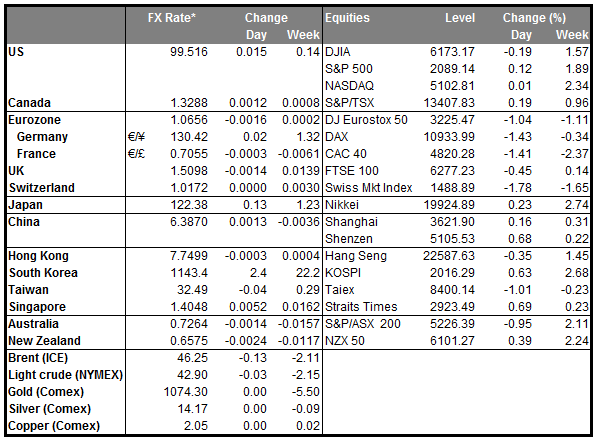
• Equity market carnage continues The start of the earnings season in the stock markets has done nothing yet to reverse the overall risk-off environment. Having already a rough start for the year, with China at the forefront of developments, US stock markets continue to decline with no clear signs for a recovery. Although only a small portion of companies have reported earnings so far, the results were overall disappointing. This risk-off environment should see demand for funding currencies intact, with currencies like JPY, EUR/USD and CHF outpacing most other currencies. The gains against the dollar however, may stay limited, as investors remain aligned behind further rate hikes from the Fed.
• Today’s highlight will be the Bank of England monetary policy meeting. No change in policy is expected while consensus is that the vote will once again be split 8-1 with Ian McCafferty to maintain his call for a rate hike. The minutes of the meeting are released at the same time as the decision, which makes meeting days more interesting than before. With the British pound hovering near its lowest levels since June 2010 vs USD, the falling commodity prices to which the UK equity market is exposed and the looming “Brexit” referendum concern, the minutes will give us the opportunity to get additional insights about members’ views on the UK economic outlook. The minutes of the last meeting showed that the committee expected November’s CPI rate to have returned to positive territory and to continue rising as the effects of falling energy prices drop out of the calculation. While inflation turned marginally positive in November, the renewed drop in oil prices and the soft wage growth is set to weigh on the Bank’s inflation outlook. That said, we will closely monitor the meeting for any hints on just how far the committee’s expectations for the first increase in the Bank rate have been pushed back.
• From Sweden, we get the CPI and CPIF for December. Both rates are forecast to have remained unchanged from the month before. Last week, the Riksbank Board gave Governor Ingves additional powers to intervene immediately in the currency market, should the exchange rate appreciate too quickly. In an attempt to combat possible deflation and appreciation of SEK that could undermine further rise in inflation. If the inflation rate fails to pick up, or if we see a negative surprise in the CPI rate, we see a possibility for the Bank to intervene in the FX market to weaken the krona.
• In Germany, the annual GDP growth rate for 2015 is forecast to have accelerated slightly from the previous year, which could support EUR a bit, at least at the release.
• In Eurozone, of particular note will be the release of the ECB minutes, which have never been a driver of the EUR since they started being released, but could be important this time. The ECB decided to cut the deposit facility rate at their last meeting and to extend the QE program for at least 6 more months. In the meantime, the Board expanded the assets they can purchase and decided to reinvest the proceeds from the bonds that mature. Since then, ECB officials stated that QE will run as long as necessary to reach the inflation target and that the deposit rate is theoretically not at its lower bound. What is more, Eurozone’s CPI rate failed to accelerate in December and stayed unchanged at 0.2% yoy. Therefore, we will look through the minutes for further hints if the Bank is willing to expand further its stimulus program.
• In the US, initial jobless claims for the week ended on the 8th of January are forecast to have decreased from the previous week, while the 4-week moving average is expected to have increased slightly.
• We have two speakers scheduled on Thursday’s agenda: Atlanta Fed President Dennis Lockhart and St. Louis Fed President James Bullard speak.
The Market
EUR/USD rebounds from near the 1.0800 zone
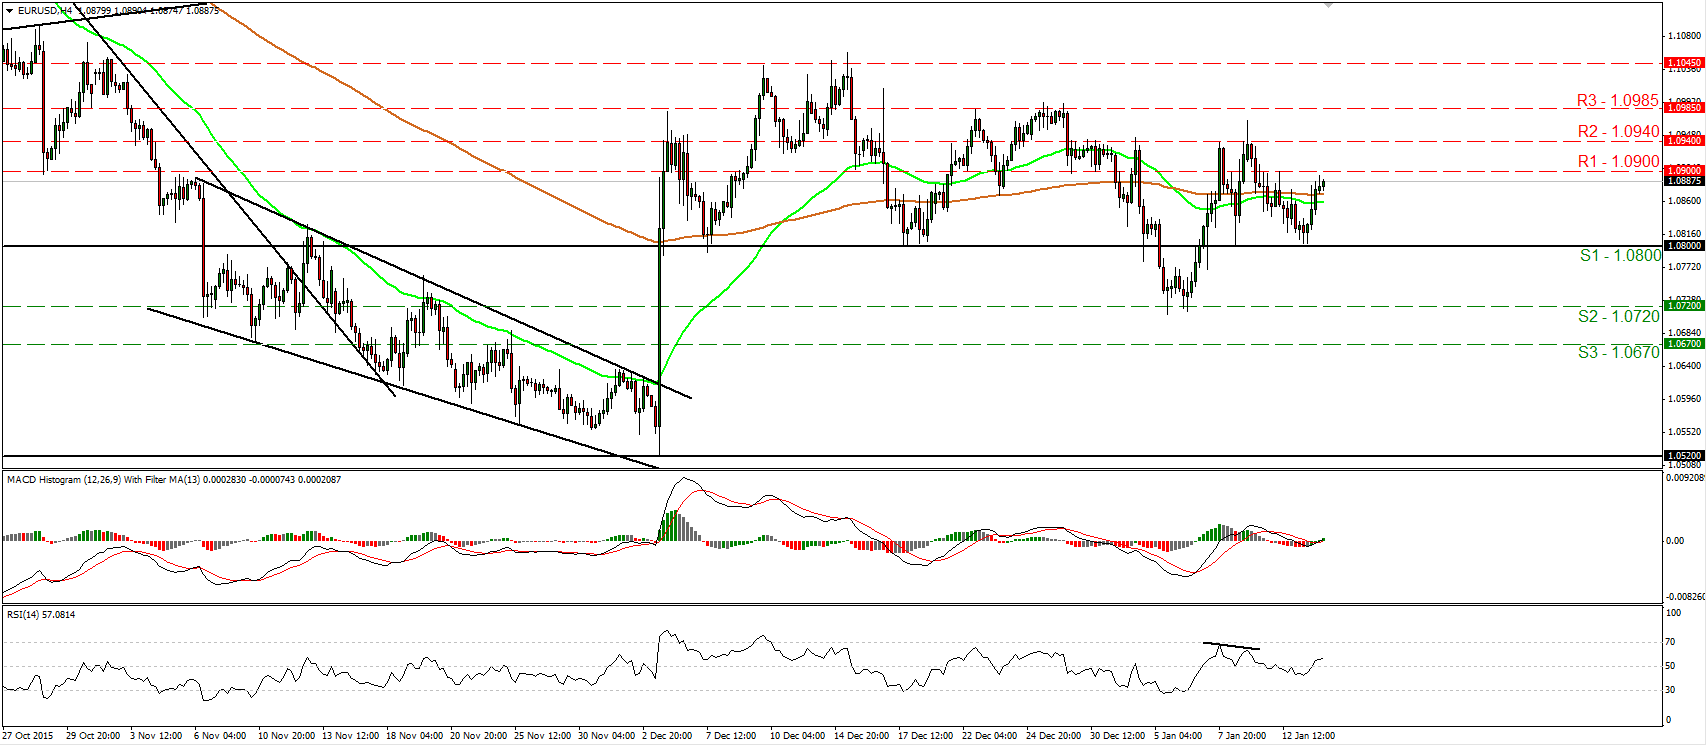
• EUR/USD traded higher on Wednesday after it found support near the 1.0800 (S1) key support hurdle. Nevertheless, the advance was stopped marginally below the 1.0900 (R1) resistance barrier. Taking into account that the rate is still trading above the 1.0800 (S1) obstacle, I prefer to maintain my “wait and see” stance for now with regards to the short-term outlook. I would like to see another dip below 1.0800 (S1) before turning my eyes back to the downside. For now, taking into account our momentum indicators, I see signs that the rebound may continue for a while, even above the 1.0900 (R1) line. The RSI moved back above its 50 line, while the MACD has bottomed slightly below zero, turned positive and poked its nose above its trigger line. Switching to the daily chart, I see that the 1.0800 (S1) key hurdle is the lower bound of the range the pair had been trading from the last days of April until the 6th of November. I also see that on the 7th and 17th of December, and on the 8th of January, the rate rebounded from that zone. Therefore, yesterday’s rebound from the 1.0800 (S1) territory makes me stay flat as far as the medium-term picture is concerned as well.
• Support: 1.0800 (S1), 1.0720 (S2), 1.0670 (S3)
• Resistance: 1.0900 (R1), 1.0940 (R2), 1.0985 (R3)
NZD/USD plunges below 0.6500
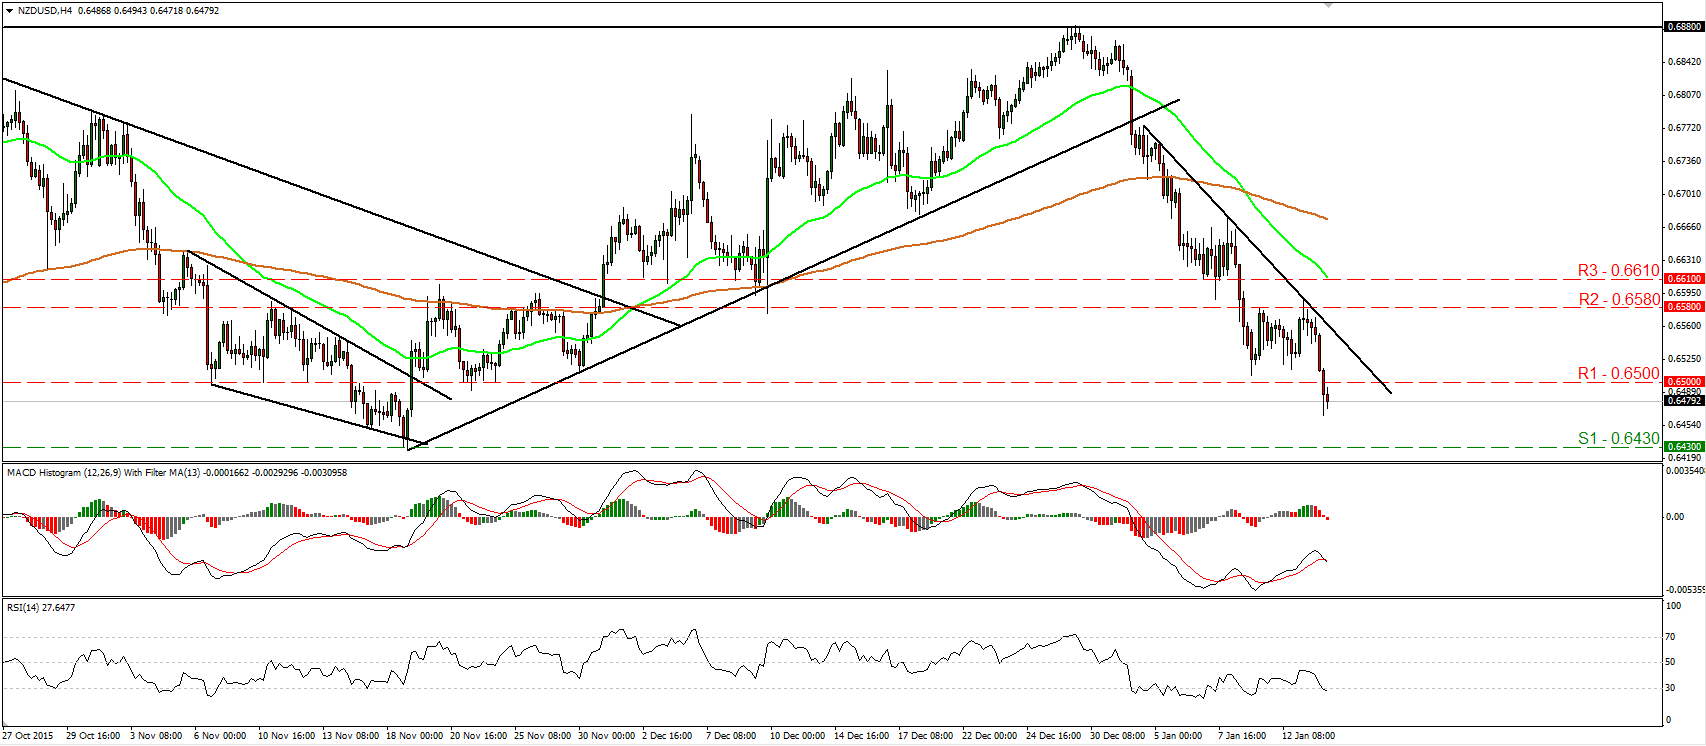
• NZD/USD plunged yesterday after it hit resistance near the 0.6580 (R2) barrier and then it fell below the psychological zone of 0.6500 (R1). The short-term picture outlook is still negative in my view and as such, I would expect the dip below 0.6500 (R1) to see scope for extensions towards the 0.6430 (S1) support zone, defined by the low of the 18th of November. Shifting my attention to our short-term momentum indicators, I see that the RSI turned down and just fell below its 30 line, while the MACD, already negative, has topped and fallen below its trigger line. These indicators detect strong downside speed and support that the pair is likely to continue falling, at least in the near term. On the daily chart, I see that on the 7th of January, NZD/USD fell below the upside support line taken from the low of the 23rd of September. However, a clear close below the 0.6430 (S1) area is needed to confirm a forthcoming lower low on the daily chart and turn the longer-term outlook to the downside as well.
• Support: 0.6430 (S1), 0.6380 (S2), 0.6340 (S3)
• Resistance: 0.6500 (R1), 0.6580 (R2), 0.6610 (R3)
GBP/JPY is testing the 169.00 area
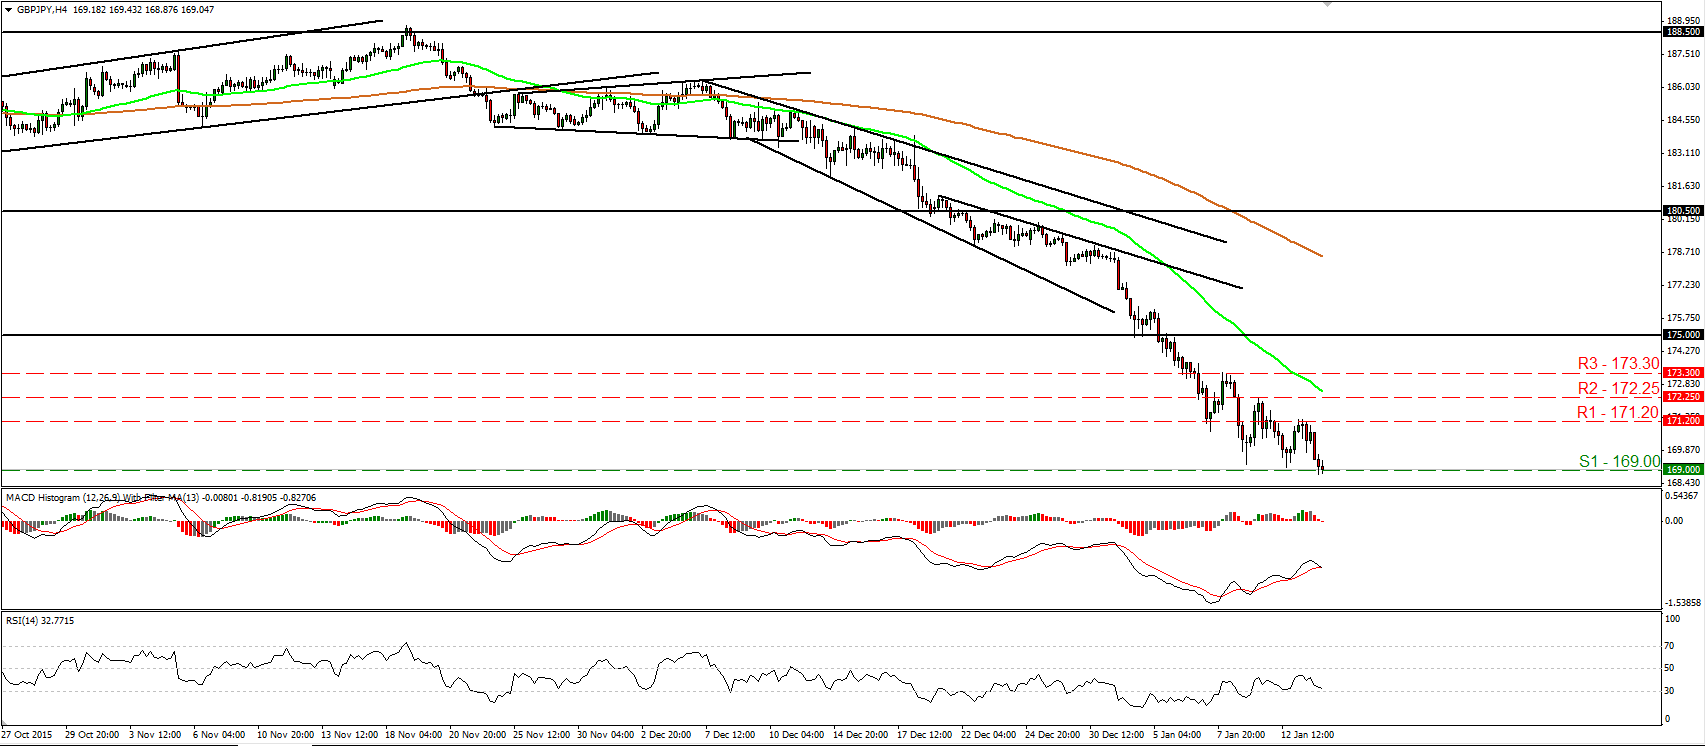
• GBP/JPY slid on Wednesday after it hit resistance at 171.20 (R1). The rate is currently testing the 169.00 (S1) support line, where a clear dip is likely to open the way for the next support area of 168.00 (S2). The price structure on the 4-hour chart still points to a downtrend, while our oscillators detect downside momentum and corroborate my view that the pair is poised to continue trading lower. The RSI turned down after it found resistance slightly below its 50 line, while the MACD, already negative, has topped and fallen below its trigger line. Zooming out to the daily chart, I see that on the 21st of December the rate fell below the 180.50 key hurdle, which is the lower bound of the wide range the pair had been trading since the 25th of August. Bearing that and that the rate is now trading below the psychological figure of 170.00, I would see a negative medium-term picture as well.
• Support: 169.00 (S1), 168.00 (S2), 167.00 (S3)
• Resistance: 171.20 (R1), 172.25 (R2), 173.30 (R3)
Gold rebounds back above 1090
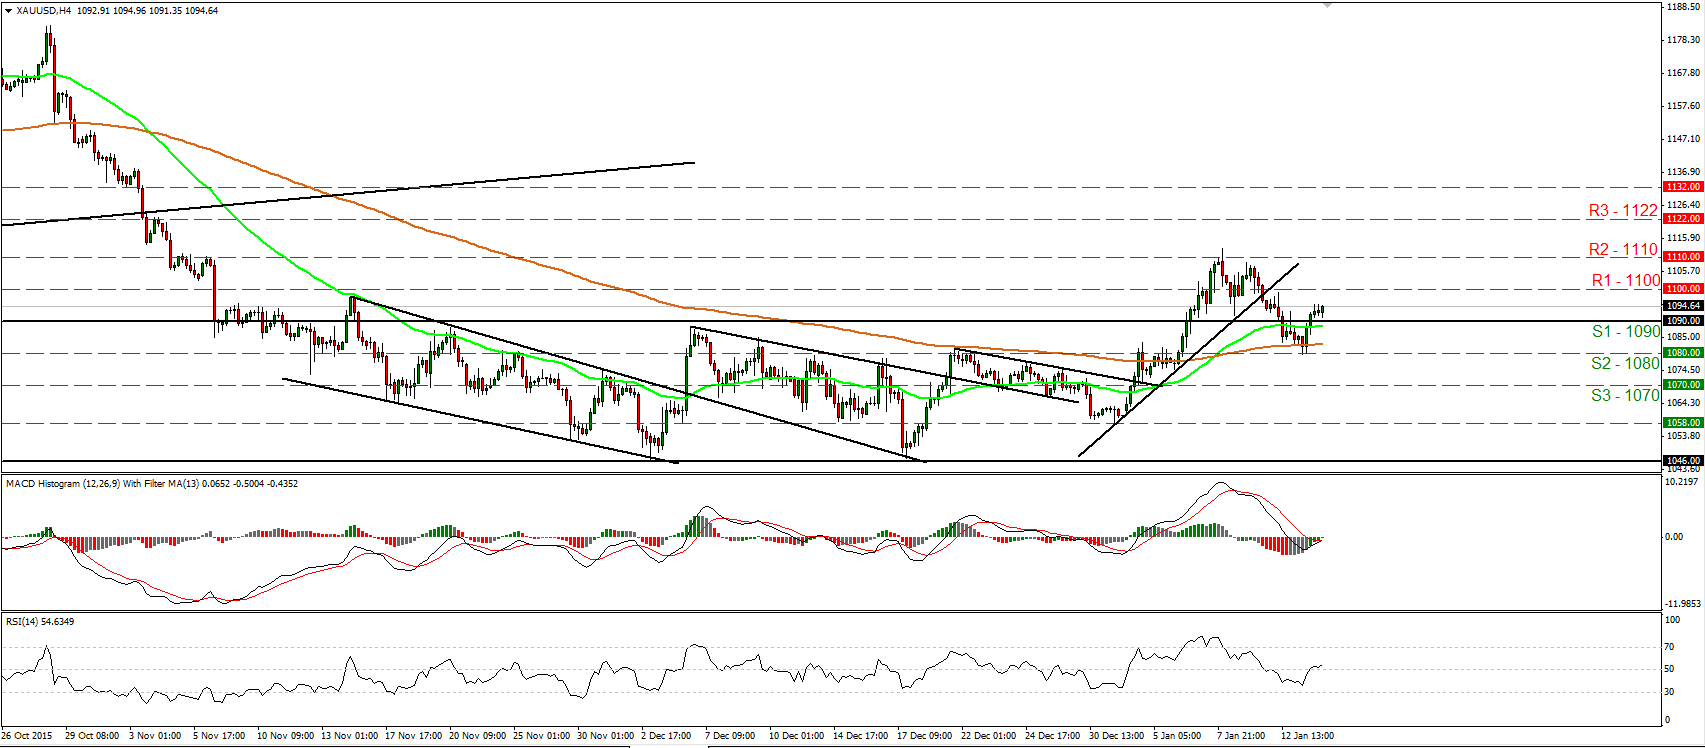
• Gold found support at 1080 (S1) yesterday and rebounded to emerge back above 1090 (S1). I would now expect the bulls to challenge the 1100 (R1) resistance hurdle and if they prove strong enough to overcome it, I would expect then to set the stage for extensions towards the next obstacle of 1110 (R2). Our short-term oscillators have both turned up, revealing upside speed for now. The RSI edged above its 50 line and is pointing north, while the MACD has bottomed and now looks able to cross above both its zero and signal lines. As for the broader trend, I see that the metal is back above the upper bound of the sideways range it had been trading from the 16th of November until the 6th of January. As a result, I would consider the medium-term outlook to have turned cautiously positive again.
• Support: 1090 (S1), 1080 (S2), 1070 (S3)
• Resistance: 1100 (R1), 1110 (R2), 1122 (R3)
DAX futures slide after hitting resistance slightly below 10200
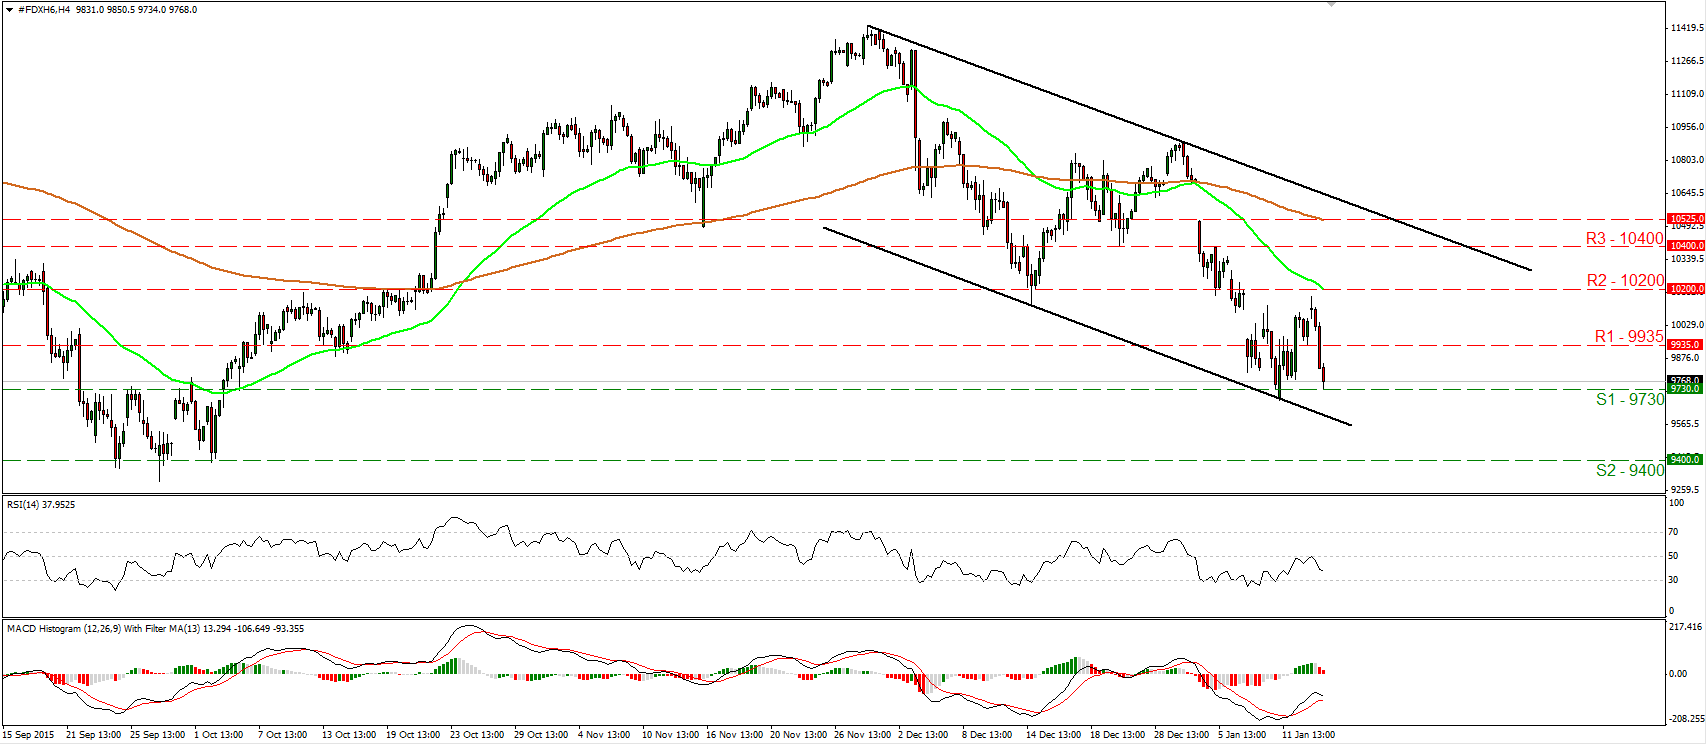
• DAX futures fell sharply yesterday after it found resistance slightly below the 10200 (R2) barrier. The decline was stopped by the 9730 (S1) support level, where a clear break is likely to set the stage for more bearish extensions, perhaps towards the next support zone of 9400 (S2). Our short-term oscillators reveal negative momentum and support the notion. The RSI edged down after it hit resistance at its 50 line, while the MACD, already negative, has topped and could fall below its trigger line soon. On the daily chart, I see that since the 1st of December the index has been printing lower peaks and lower troughs, something that keeps the longer-term picture negative as well.
• Support: 9730 (S1), 9400 (S2), 9230 (S3)
• Resistance: 9935 (R1), 10200 (R2), 10400 (R3)


