
European and US equities traded well in the green yesterday, perhaps due to speculation that China may soon start removing covid-related restriction, and also due to decent US retail sales data.
However, with Fed Chair Jerome Powell saying that they are committed to do what’s necessary to bring inflation down, we cannot say that this is the start of a bullish reversal. As for today, we get Canada’s CPIs for April and during the Asian session Thursday, we have Australia’s employment report.
Equities Gain, But Powell Keeps The Door Open For More Aggressive Tightening
The US dollar traded lower against all the major currencies on Tuesday and during the Asian session Wednesday. It lost the most ground against GBP, EUR, and CHF, in that order, while it lost the least versus CAD.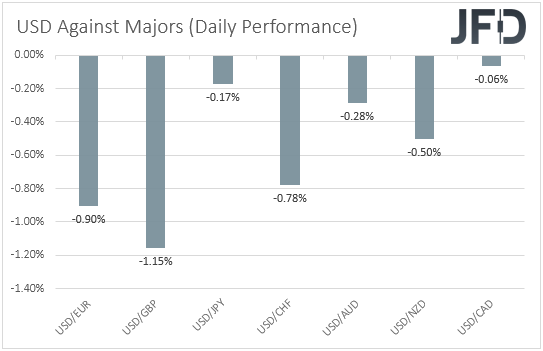
In our view, the weakening of the US dollar suggests that market sentiment remained supported yesterday and today in Asia, and indeed, turning our gaze to the equity world, we see that major EU and US indices were a sea of green. However, sentiment softened during the Asian trading today.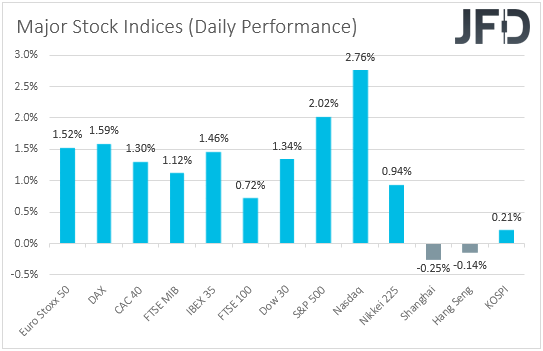
EU shares may have taken the torch from the Asian ones, which traded in the green on Tuesday. Remember, yesterday, we noted that there was no clear catalyst for that but from what we understand now this may have been due to China achieving three days in a row without new coronavirus cases outside quarantine zones, something that may have raised speculation that restrictions may start to be removed soon.
Appetite improved even more during the US trading, and the extra fuel may have come from the US retail sales data. Headline sales slowed to +0.9% mom from an upwardly revised +1.4%, while the core rate slid to +0.6% mom from an upwardly revised +2.1%. The headline rate matched its own consensus, while the core one was higher. It seems that a higher core rate and the upside revisions for the month of March may have erased some concerns with regards to the performance of the US economy, and that’s why Wall Street extended its latest recovery.
However, our own view is that better economic data from the US are likely to spark fresh speculation for a faster tightening by the Fed.
Yesterday, Fed Chair Jerome Powell said:
"What we need to see is inflation coming down in a clear and convincing way and we're going to keep pushing until we see that."
Adding:
"If we don't see that, we will have to consider moving more aggressively."
So, reading between the lines this means that they are not planning to deliver 75bps hikes at the moment, but they don’t rule that out if needed. If he was considering that now he wouldn’t have said “if we don’t see that”. So, it seems that for now he sticks to his guns of 50bps increases for the next couple of meetings. Market participants appear to agree with our view as well. According to the CME FedWatch tool, the probability for a double hike at next month’s gathering remains at 90%.
In any case, our point is that Powell is not totally dismissing the chance for 75bps hikes in a few months if inflation does not come down. So, with that in mind, we cannot confidently say that the latest recovery in equities is the start of a bullish reversal. After all, from a technical point of view, all three of Wall Street’s main indices remain below downside resistance lines. Thus, for now, we will consider the current recovery as a corrective move. What’s more, despite some speculation that China could start lifting Covid-related restrictions soon, and despite the decent US retail sales data, concerns over the performance of the global economy are still there, which combined with the element of uncertainty surrounding the war in Ukraine, could keep the recovery limited and short-lived.
NASDAQ 100 – Technical Outlook
The NASDAQ 100 cash index traded higher yesterday, after it hit support at 12175 on Monday. However, the advance was stopped around the 12550 zone, marked by the highs of May 10 and 11, still below the downside resistance line taken from the high of Apr. 5. As long as the index remains below that line, we would see decent chances for the bears to take charge again soon.
A clear dip back below 12175 could confirm that case and may pave the way towards the low of May 12, at 11690, or the 11505 zone, marked by the low of Nov. 10, 2020. Another break, below 11505, could extend the decline towards the 10940 territory, marked by the low of Nov. 2, 2020.
On the upside, we would like to see a clear break above 12935 before we start examining a short-term bullish reversal. This could initially pave the way towards the 13545 zone, marked by the high of May 5, or the 13745 hurdle, marked by the inside swing low of Apr. 18. If neither barrier is able to stop the advance, then a break higher could carry extensions towards eth peak of Apr. 21, at 14285.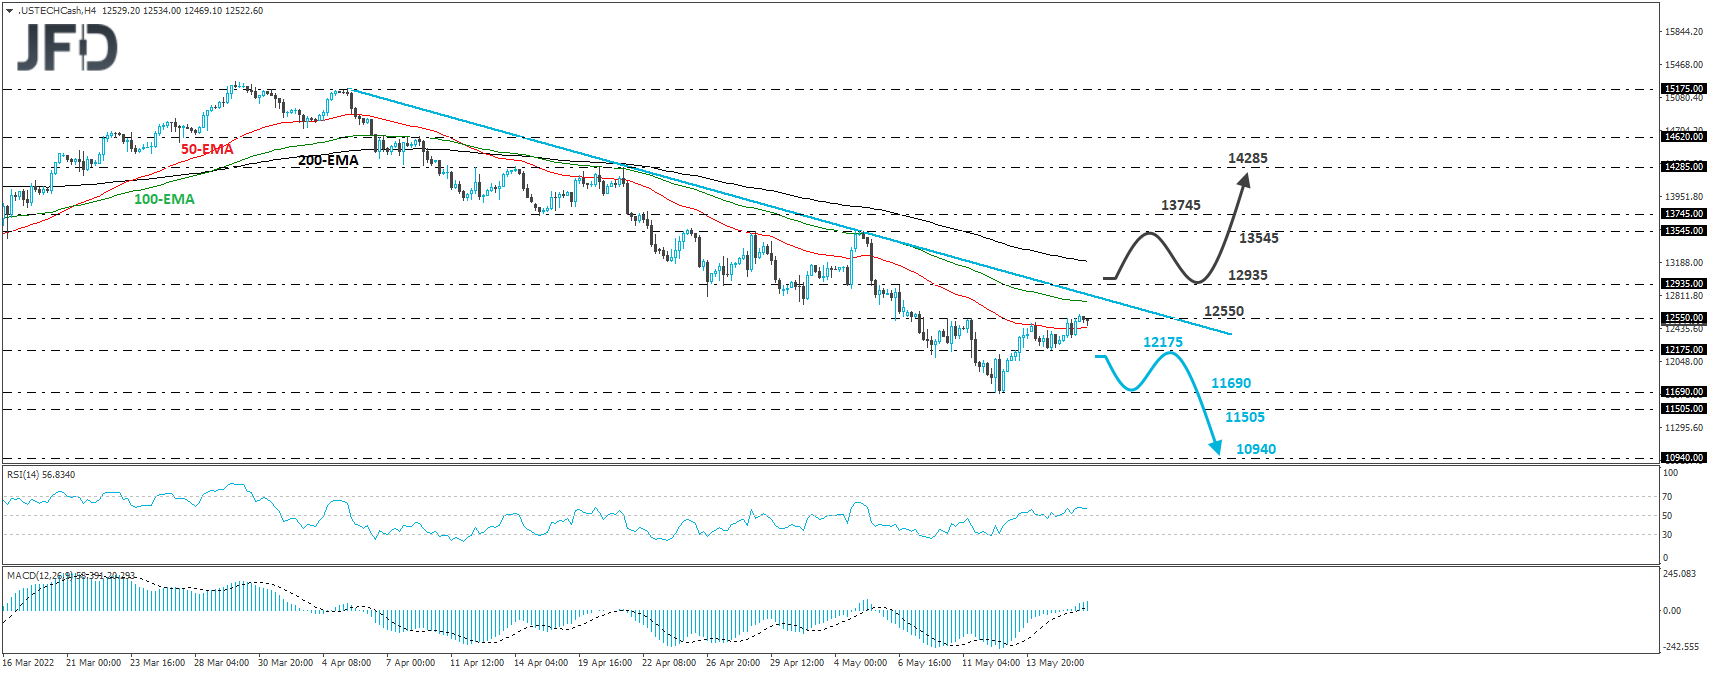
EUR/USD – Technical Outlook
EUR/USD continued to climb higher, breaking above the key resistance (now turned back into support) zone of 1.0470/90. However, the rate remains below the downside resistance line taken from the high of Mar. 31, and thus, we would still consider the short-term outlook to be bearish.
We believe that a break back below 1.0470 could confirm the case of a trend continuation, and we may see the bears pushing for another test near the 1.0350 territory, marked by the lows of May 12 and 13. If that zone doesn’t hold this time around, then a break lower could pave the way all the way down to the 1.0235 area, defined as a support by the inside swing high of July 2002.
In order to start examining a bullish reversal, we would like to see a clear break above 1.0695. This could initially aim for the 1.0760 zone, marked by the inside swing lows of Apr. 14 and 19, the break of which could carry extensions towards the 1.0845 level, marked near the high of Apr. 22. If that barrier is also broken, then we are likely to experience upside extensions towards the peak of the day before, at 1.0935.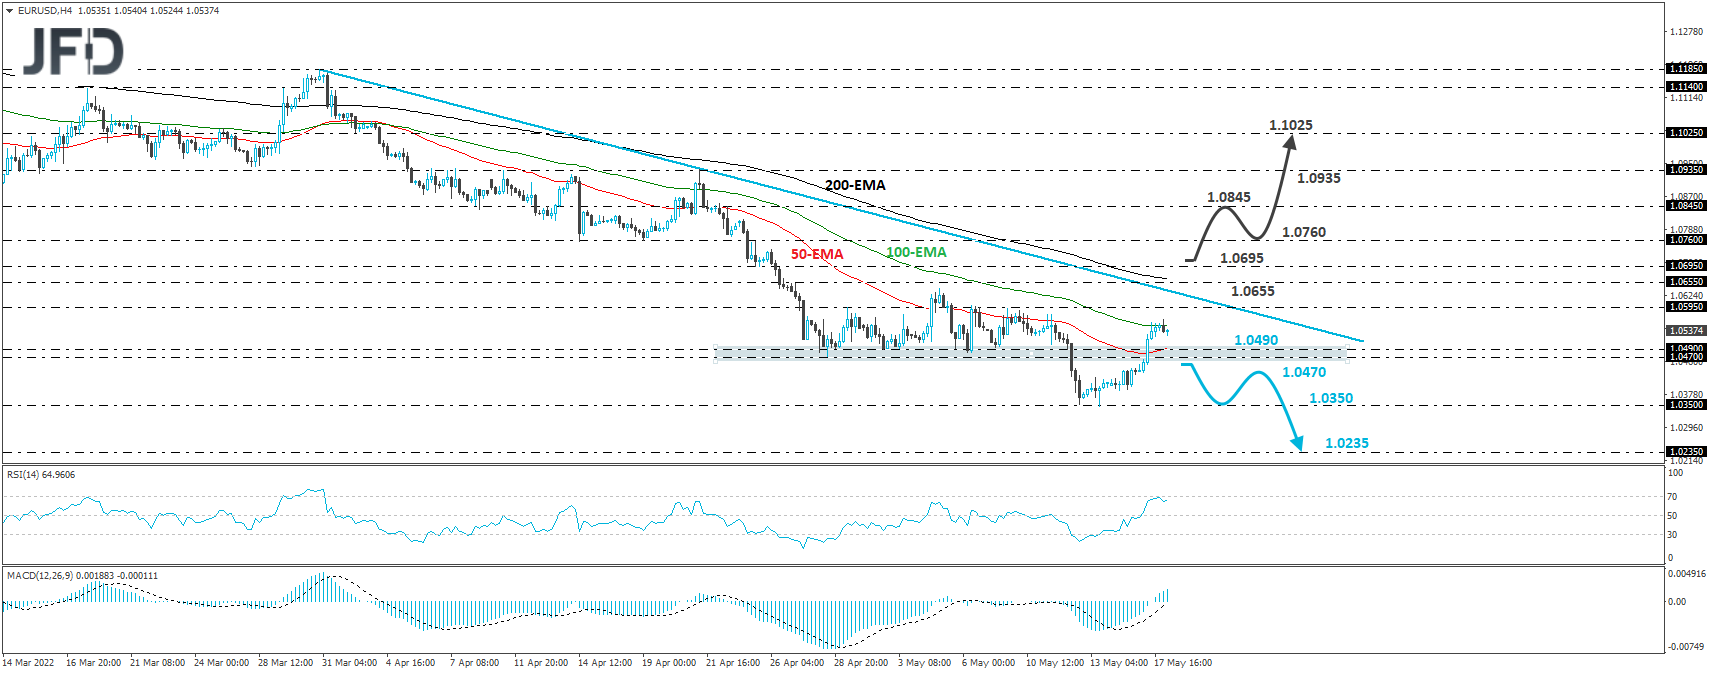
As for Today’s Events
During the early European session, we already got the UK CPIs for April, with the headline rate jumping to +9.0% yoy from +7.0%. This adds credence to the view that the BoE is likely to continue raising interest rates, but the concerns over a recession next year are likely to keep the path slow.
Later in the day, we get more CPI data for April, this time from Canada. The headline rate is forecast to have held steady at +6.7% yoy, while the core one is anticipated to have declined to +4.2% yoy from +5.5%. At its latest gathering, the BoC decided to hike rates by 50bps as was expected, noting that interest rates will need to rise further. Governor Macklem specifically said: “We need higher rates, and the economy can handle them”, adding that they are prepared to move as forcefully as needed to get inflation on target.
However, a decent slowdown in underlying inflation may be an indication that this Bank, although within the hawkish group of the majors, may not need to hike as fast as initially estimated, or at least not as fast as the Fed. Something like that could result in another upside wave in USD/CAD.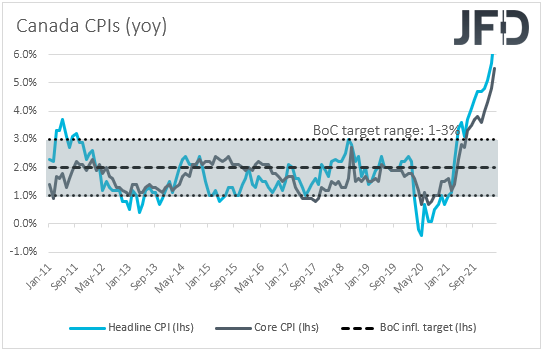
Later, during the Asian session Thursday, Australia releases its employment report for April. The unemployment rate is forecast to have ticked down to 3.9% from 4.0%, while the net change in employment is forecast to show that the economy has added 30k jobs after gaining 17.9k in March.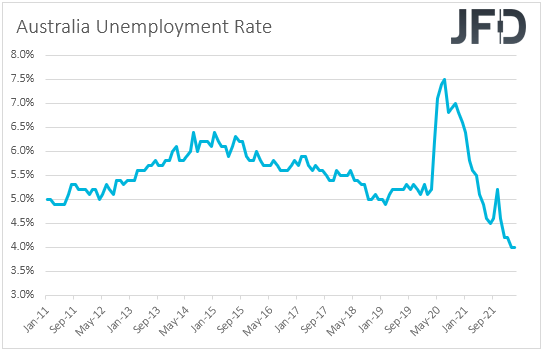
Overall, these numbers point to a decent report and may support somewhat the Aussie, especially after the minutes of the latest RBA gathering added some credence to market expectations around the RBA’s future course of action. However, we stick to our guns that the Aussie is likely to stay in a downtrend mode. Due to its risk-linked status and Australia’s close trade relationship with China, it is feeling the heat of global growth concerns more than monetary policy expectations.