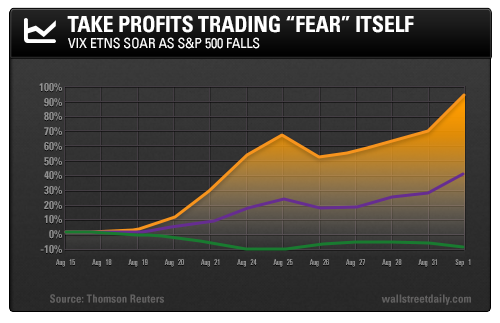
August was a terrible month for the stock market. In fact, it wasn’t just bad – it was historically bad.
The S&P 500 fell 6%. The NASDAQ fell 8%. And the Dow Jones Industrial Average posted its worst August performance of the last 17 years.
Meanwhile, you’ve likely heard the word “volatile” used a hundred times to describe last month’s action. But what you might not know is that this market volatility can be quantified and traded like a stock.
It’s one of Wall Street’s best-kept secrets, and I’m going to demonstrate how you can exploit it for profit.
Enter the VIX
The CBOE Volatility Index, or VIX, is a measure of implied volatility of S&P 500 options. You might also know the VIX as the so-called “fear gauge.”
Since 1990, the index has been used to forecast large directional moves in the stock market. At its core, volatility is simply the measure of variance of a security’s returns. One of the methods most commonly used to calculate volatility is the standard deviation of a given return.
In the context of equity options, the volatility of the underlying asset is built into the premium (price). Generally, the more volatile a stock is, the more expensive its options will be at any given time. This concept also applies to the broader market. The VIX is an average of option premiums on the S&P 500 itself.
So, if things are calm in the market and investor confidence is high, the VIX will be low. Conversely, when market confidence wanes and trading gets choppy, the VIX will rise.
The all-time average reading on the VIX is 20. The index bottomed out in 2007 around 10 and peaked at the height of the financial crisis in 2008 at almost 90. Right now, the VIX is above average at 30.
Options Traders Love the VIX
The VIX is a major technical indicator used by options traders to determine strategy. You’ll recall, option prices have a direct relationship to market volatility. When volatility is low in a bull market, buying long calls is an affordable alternative to buying stocks. On the other hand, when the VIX spikes and option premiums rise, selling options becomes an attractive way to generate income.
Now, you can’t buy the VIX itself, but you can trade options and futures on the index. And even if you don’t trade derivatives, you’re still in luck.
The iPath S&P 500 VIX Short-Term Futures (NYSE:VXX) and the iPath S&P 500 VIX Mid Term Futures (NYSE:VXZ) offer cheap and lucrative exposure to the VIX through the futures market. And they trade just like stocks – no options trading required.
Both products have a negative correlation to the S&P 500, so when the index falls sharply, VXX and VXZ are up big. These two ETNs were among the first volatility trading products, and they remain intensely popular – especially over the last few weeks, when the market went full-blown rollercoaster.

VXX’s value is derived from the S&P 500 VIX Short-Term Futures Index. This index tracks the front month and second month VIX futures contracts, and it has a higher risk/reward ratio than VXZ. It’s also more volatile, as the last month has demonstrated. VXX has gained a whopping 95% from an all-time low on August 15.
On the other hand, the price of VXZ is derived from the S&P 500 VIX Mid-Term Futures Index. The mid-term index tracks contracts of the fourth month through the seventh month. This product is a potent, less-volatile play on the VIX, and is well-suited for more conservative traders. It has gained 40% since July 30.
Now, the caveat with these two ETNs is that they’re not meant to be held long term. But if you’re up for the challenge of timing a downside market move just right, you can make a fortune in a very short time frame.
