Get 40% Off
💰 Warren Buffet reveals a $6.72 billion stake in ChubbCopy Portfolios

8 ETF Charts And What They May Reveal

Published 10/25/2020, 01:46 AM
Updated 07/09/2023, 06:31 AM
DIA
-
EEM
-
SPY
-
QQQ
-
DBC
-
IWM
-
IXIC
-
GDX
-
XLP
-

Let’s take a quick stroll as we approach the last week before the Election. I wanted to say a few words about each of the eight ETFs below.

First up is commodities, by way of the symbol DB Commodity Index Tracking Fund (NYSE:DBC). Everywhere I turn, the experts are saying commodities are going to be roaring higher for years to come. I disagree; I think the long-term trend is downward.
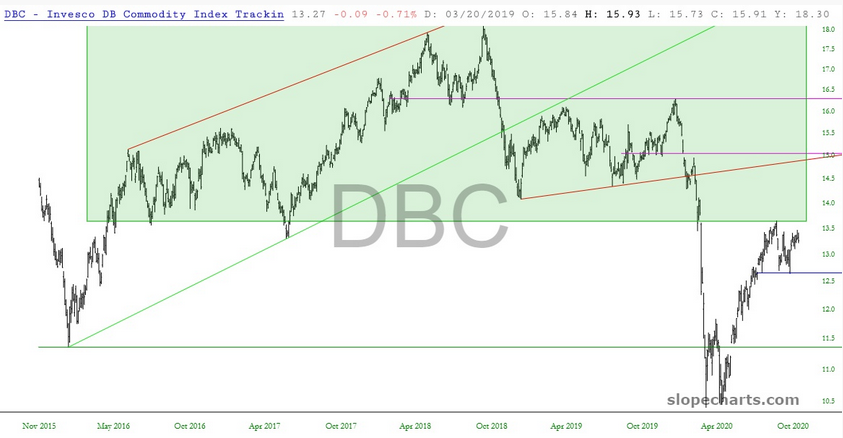
DBC ETF Chart

Equities continue to be annoyingly indecisive. On the one hand, there are far too many uncertainties in the weeks ahead to really let prices shoot higher, yet on the other, the Fed’s endless asset buying will keep the helium-filled in the balloons. The “Diamonds)” are bouncing along their long-term trendline, sputtering to a tight range.
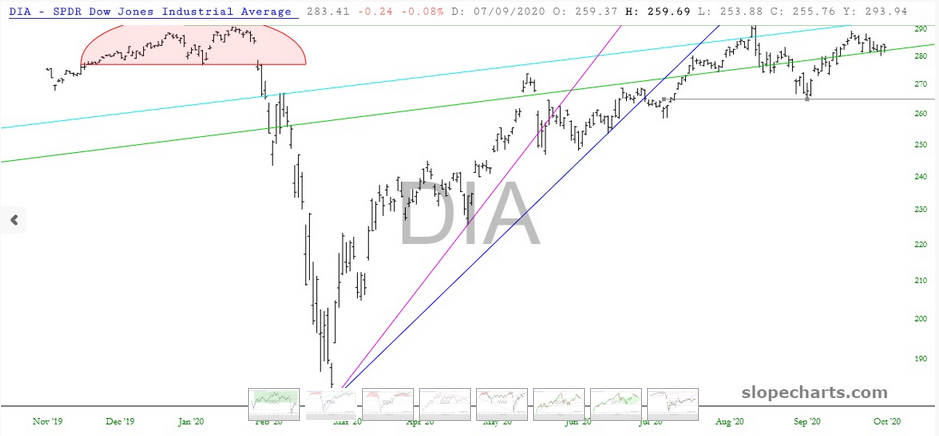
DIA Chart

Emerging Markets ETF (NYSE:EEM), however, seem to have reached escape velocity. There had been (past tense) a lovely parallel between the two arched tops I’ve tinted, but that was busted a few weeks ago, and emerging markets are surprisingly strong.
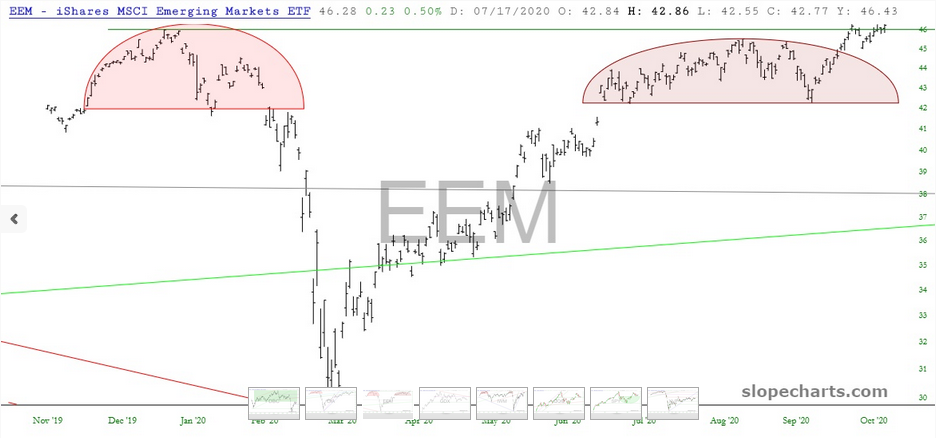
EEM Chart

Miners ETF (NYSE:GDX), however, looked poised for pain.
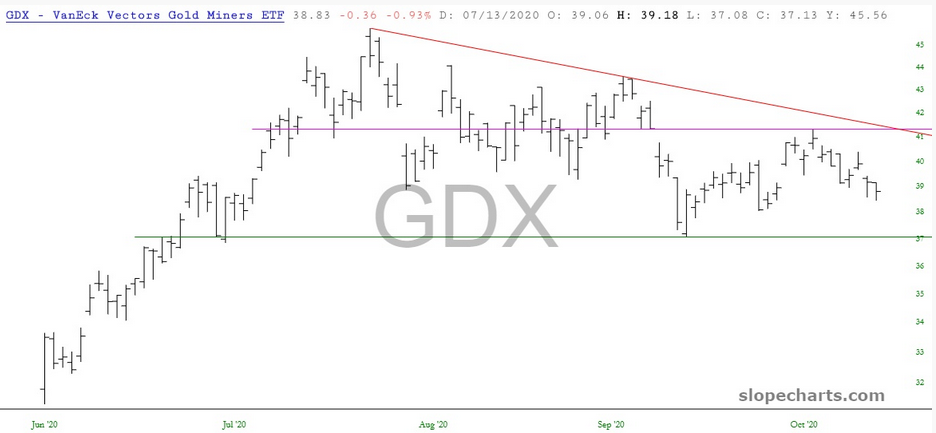
GDX Chart

My principal obsession, the small caps, have an exceptionally well-formed chart that is rich with information. My belief is that the past couple of weeks have been nothing but the prices banging their head on the underside of the broken red trendline that I’ve drawn below. It can’t seem to “let go” for prices to descend as they did in the autumn of 2018 and spring of this year.
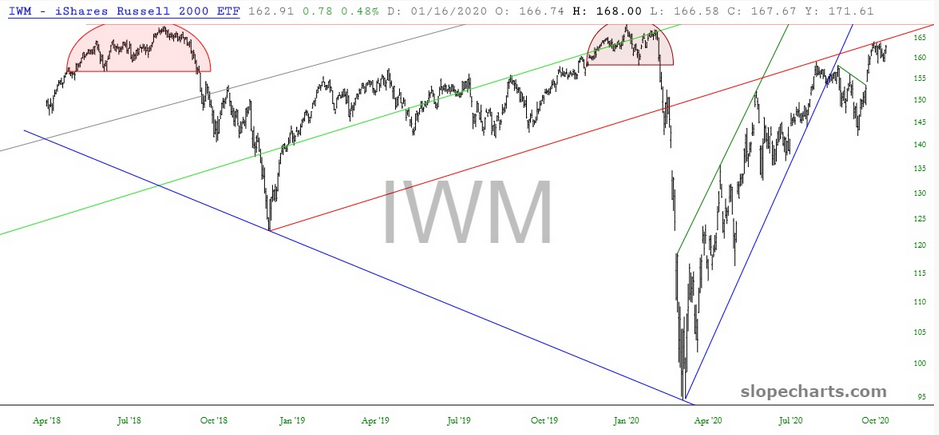
IWM Chart

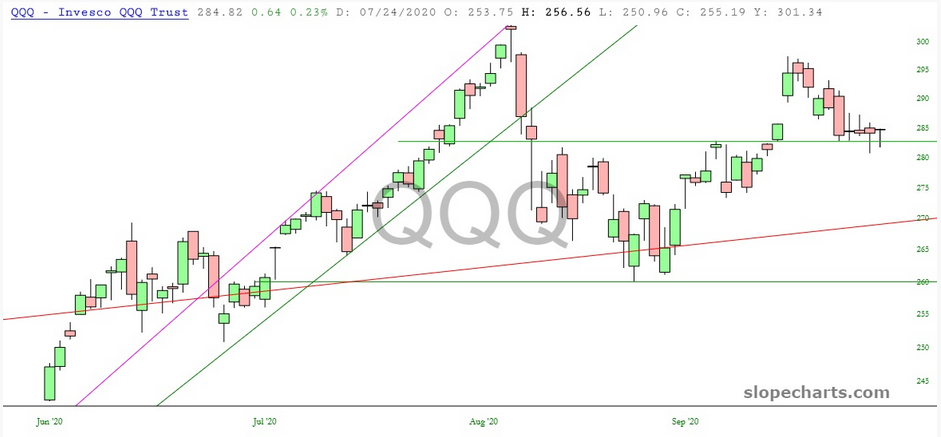
Looking closer, this time at the NASDAQ, we see the tiny basing pattern is being challenged. We are about to enter the meat of earnings season, with all the most important players reporting in the days ahead.
3rd party Ad. Not an offer or recommendation by Investing.com. See disclosure here or remove ads .

QQQ Chart

Cleaner than the QQQ, the SPY continues to respect its own basing pattern. If, for whatever reason, the results of the 11/3 election cause mass celebration, that saucer will probably be seen in retrospect as the launching-off mark for the next phase of this lovely bull market which delights me so.
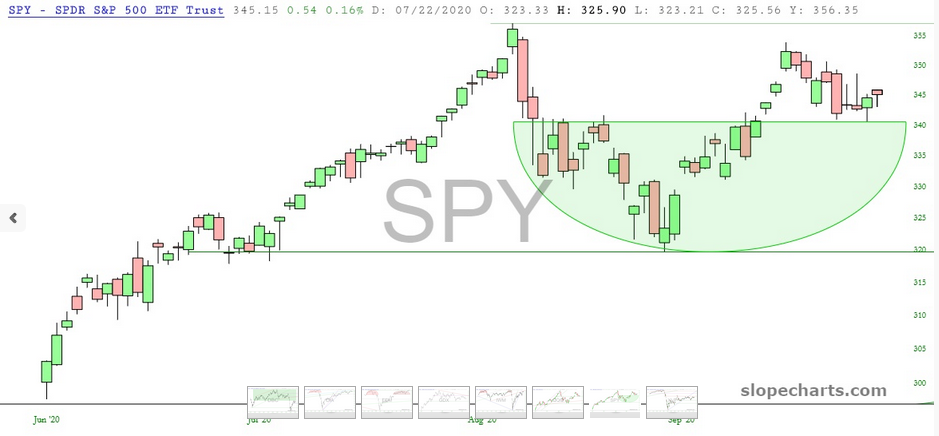
SPY Chart

Lastly, there is Consumer Staples (NYSE:XLP), which have been range-bound for months. If the above SPY chart were to rip higher (post-election), I daresay the red horizontal below would likewise be shunted aside.
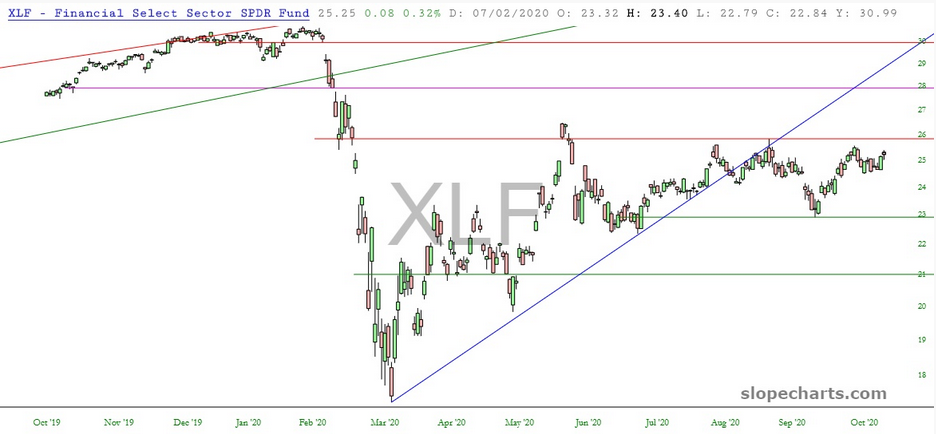
XLF Chart

Latest comments

Could you please double check if you were talking about XLP or XLF? The chart is XLF prices
Tim, I read your articles often as they are helpful and insightful but at times I come away more confused.  In good ole layman's terms; please give us your thoughts on the chart patters in SPX AND NDX.  There appears to be a completed cup and handle or inverse head and shoulders formation at present.  If you agree, what are your expectations as they seem to coincide with your present article?  Thanks.
Risk Disclosure: Trading in financial instruments and/or cryptocurrencies involves high risks including the risk of losing some, or all, of your investment amount, and may not be suitable for all investors. Prices of cryptocurrencies are extremely volatile and may be affected by external factors such as financial, regulatory or political events. Trading on margin increases the financial risks.
Before deciding to trade in financial instrument or cryptocurrencies you should be fully informed of the risks and costs associated with trading the financial markets, carefully consider your investment objectives, level of experience, and risk appetite, and seek professional advice where needed.
Fusion Media would like to remind you that the data contained in this website is not necessarily real-time nor accurate. The data and prices on the website are not necessarily provided by any market or exchange, but may be provided by market makers, and so prices may not be accurate and may differ from the actual price at any given market, meaning prices are indicative and not appropriate for trading purposes. Fusion Media and any provider of the data contained in this website will not accept liability for any loss or damage as a result of your trading, or your reliance on the information contained within this website.
It is prohibited to use, store, reproduce, display, modify, transmit or distribute the data contained in this website without the explicit prior written permission of Fusion Media and/or the data provider. All intellectual property rights are reserved by the providers and/or the exchange providing the data contained in this website.
Fusion Media may be compensated by the advertisers that appear on the website, based on your interaction with the advertisements or advertisers.
© 2007-2024 - Fusion Media Limited. All Rights Reserved.