I read tea leaves which are constantly in motion. It not hard for me to paint a doom-and-gloom picture one week, and the next week say that everything is coming up roses. I do not fall in love with the words which come out of my mouth, or feel the need to produce analysis to defend many of my outlooks. Every analysis starts with a clean piece of paper.
Follow up:
The USA has a crappy economy since 2007 (and arguably for all of the 21st century). No data I am seeing is signaling an end to the crappy economy. My forecasts and outlook have been predominately more negative for most of 2015 - and this outlook has continued into 2016. In a big picture view, the crappy economy was expanding at an even crappier rate compared to other non-recessionary periods of the 21st century.
But economic forecasts are relative to where one is standing today. It is easy to understand that when you compare data year-over-year, a current relatively soft period may look better if you are comparing it to an even softer period. In short, all analysis is relative.
I happen to be a fan of using non-monetary data - especially data which is not subject to revision. This makes trending much more accurate as the trends are not changed when later data releases revise the previous months' data. One of my favorite data sources is container counts from the Los Angeles ports where final data is normally issued within 15 days of period ending. This makes container counts a particularly a good forecasting tool as import final sales are added to GDP usually several months after import - while the import cost itself is subtracted from GDP in the month of import. Export final sales occur around the date of export. Container counts do not include bulk commodities such as oil or autos which are not shipped in containers.
There has been fairly good correlation between container exports / imports and economic activity. There is no such thing as a perfect data source (or correlations) but container counts seem better than most. [Note of caution: It is dangerous to base any conclusions on a single data set].
I use a data set based on the Ports of LA and Long Beach which account for much (approximately 40%) of the container movement into and out of the United States - and these two ports report their data significantly earlier than other USA ports. Most of the high value cargo move between countries in sea containers (except larger rolling items such as automobiles).
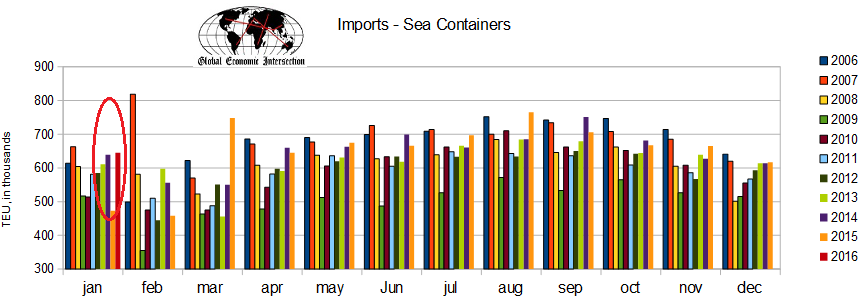
For January, there was improvement over January 2015.
Unadjusted Import Container Counts - Ports of Los Angeles and Long Beach Combined
Unadjusted Export Container Counts - Ports of Los Angeles and Long Beach Combined
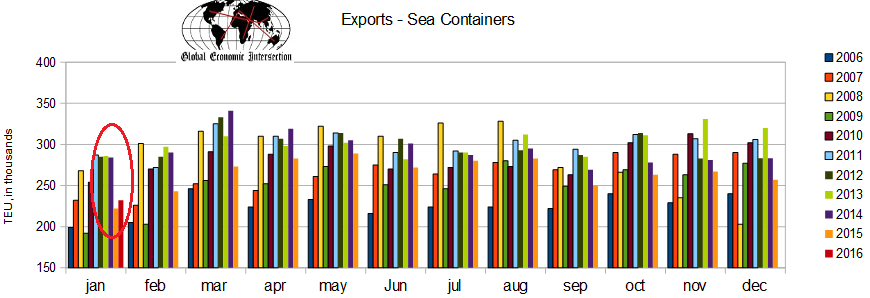
Imports had the best January since 2007, but the export improvement was only relative to the terrible 2015 levels.
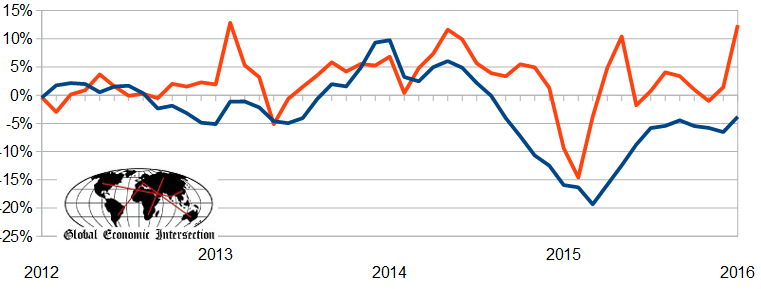
Unadjusted 3 Month Rolling Average for Container Counts Year-over-Year Change (comparing the 3 month average one year ago to the current 3 month average) - Ports of Los Angeles and Long Beach Combined - Imports (red line) and Exports (blue line)
In some of my recent posts, I have reminded that we should expect an "improving" economy the deeper the USA goes into 2016. We are comparing the terrible 2015 data to 2016. But getting real - the economy continues to perform under potential - and all that is happening is comparing two ugly pigs.
Other Economic News this Week:
The Econintersect Economic Index for February 2016 declined again, and is barely positive - and still remains at the lowest value since the end of the Great Recession. The tracked sectors of the economy which showed growth were mostly offset by the sectors in contraction. Our economic index remains in a long term decline since late 2014.
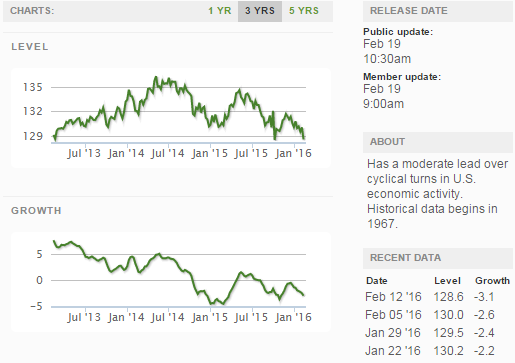
Current ECRI WLI Growth Index
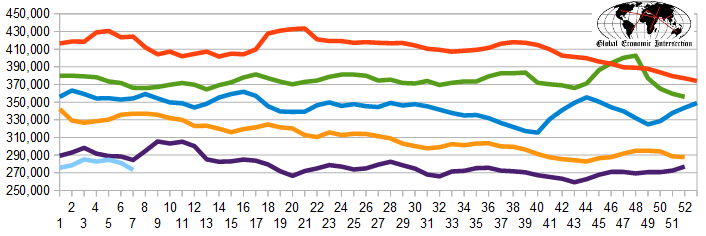
Bloomberg did not issue expectations this week, and the Department of Labor reported 262,000 new claims. The more important (because of the volatility in the weekly reported claims and seasonality errors in adjusting the data) 4 week moving average moved from 281,250 (reported last week as 281,250) to 273,250. The rolling averages generally have been equal to or under 300,000 since August 2014.
Weekly Initial Unemployment Claims - 4 Week Average - Seasonally Adjusted - 2011 (red line), 2012 (green line), 2013 (blue line), 2014 (orange line), 2015 (violet line)
Bankruptcies this Week: Paragon Offshore
Click here to view the scorecard table below with active hyperlinks
Weekly Economic Release Scorecard:
