Draghi Reinforces Easing Expections
The low volatility combined with low yields continue with no real end in sight. US yields might be preparing for a rally but with the ECB compressing European rates, yield driven FX trades should continue to perform. ECB President Mario Draghi has further strengthened expectations that the Central Bank take some action after admitting that "pre-emptive action" may be needed to head off deflation or unjustified tightening of monetary and financial conditions. The debate is ongoing if the easing will take the form of cut in interest rates, deploy a long-term lending facility (LTRO) or unveiling a full blow American style bond-buying program at the June meeting. At the ECB’s Forum on Central banking in Portugal Draghi stated, " we need to be particularly watchful for at the moment is, in my view, the potential for a negative spiral to take hold between low inflation, falling inflation expectations and credit, in particular in stressed countries." With European inflation data falling to 0.5% from 0.7% in April and growth slowing in key nations the question that stands is not “if” or “when” but “how”. The EUR/USD remains on offer since these comments hit the street.
German And French PMI Diverge
The divergence between German and French composite PMIs widened in May. The growing gap suggests that the European economic recovery is not spreading as many had predicted. That lack of spillover effect renews concern that the Eurozone's second largest economy could drag down the regions broader economic outlook. Preliminary French composite purchasing managers’ index fell to a seasonally adjusted 49.3 in May from a reading of 50.6 in April. Yet German composite PMI held steady near a 3-year high at 56.1. With Q1 preliminary GDP estimates already flat lining, forecasts of economic growth accelerations seem premature. In addition, the EU output price components for the service sector declined indicating downside pressure on inflation is increasing. The overall data will clearly embodied the European Central Bank doves.
Reduction On Interest Paid Likely
Markets are still discussing possible ECB actions, but the strategy of reducing interest paid at its deposit facility on excess reserves by 10bp has caught a lot of attention. Logically the reduction should increase lending yet in actuality there is scant evidence of noticeable economic benefits. By reducing rates, the ECB hopes to stimulate commercial bank lending as banks prefer to search for returns rather than being taxed for hording capital. The resulting search for returns should drag down interest rates, increase appetite and induce spending, lifting the economy. Recent data has shown that while bank deposits might decrease and currency in circulation might increase, real spending by businesses and households are limited. This is why the Fed has not tried a similar measure on its nearly $2.5trn in deposits. In addition, we suspect that reduction will stimulate higher risk appetite, sending banks to speculate in financial markets promoting asset bubbles. While the ECB needs to act, we are unconvinced that they have the necessary effective tools at their disposal. The lack of an astute strategy will have investors piling back into the euro.

Today's Key Issues (time in GMT):
T06:00:00 CHF Apr Trade Balance, exp 2.10B, last 2.05B, rev 2.00BT06:00:00 CHF Apr Exports Real MoM, last -1.20%, rev -1.10%
T06:00:00 CHF Apr Imports Real MoM, last -4.50%, rev -3.90%
T07:30:00 SEK Apr Trade Balance, exp 5.5B, last 2.6B
T08:30:00 GBP Apr BBA Loans for House Purchase, exp 45100, last 45933
T12:30:00 USD Apr Durable Goods Orders, exp -0.70%, last 2.60%, rev 2.50%
T12:30:00 USD Apr Durables Ex Transportation, exp 0.00%, last 2.00%, rev 2.10%
T12:30:00 USD Apr Cap Goods Orders Nondef Ex Air, exp -0.30%, last 2.20%, rev 2.90%
T12:30:00 USD Apr Cap Goods Ship Nondef Ex Air, exp -0.10%, last 1.00%, rev 1.50%
T13:00:00 USD Mar FHFA House Price Index MoM, exp 0.50%, last 0.60%
T13:00:00 USD 1Q House Price Purchase Index QoQ, exp 1.30%, last 1.20%
T13:00:00 USD Mar S&P/CS 20 City MoM SA, exp 0.70%, last 0.76%
T13:00:00 USD Mar S&P/CS Composite-20 YoY, exp 11.75%, last 12.86%
T13:00:00 USD 1Q S&P/Case-Shiller US HPI YoY, last 11.30%
T13:45:00 USD May P Markit US Composite PMI, last 55.6
T13:45:00 USD May P Markit US Services PMI, exp 54.5, last 55
T14:00:00 USD May Consumer Confidence Index, exp 83, last 82.3
T14:00:00 USD May Richmond Fed Manufact. Index, exp 5, last 7
T14:30:00 USD May Dallas Fed Manf. Activity, exp 9.2, last 11.7
The Risk Today:
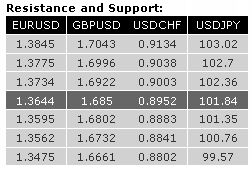
EUR/USD: has breached the strong support at 1.3643 (see also the 200 day moving average), but has thus far failed to hold below it. However, the technical structure is negative as long as prices remain below the resistance at 1.3734 (19/05/2014 high). Another resistance can be found at 1.3775 (12/05/2014 high), whereas another support lies at 1.3562 (12/02/2014 low). In the longer term, EUR/USD has broken its long-term rising trendline (see also the support at 1.3673), indicating a clear deterioration of the underlying bullish momentum. A decisive break of the key support at 1.3643 (27/02/2014 low) is needed to confirm a long-term bearish trend reversal (potential double-top).
GBP/USD: continues to move within its rising channel. In the shorter-term, monitor the hourly horizontal range between the support at 1.6802 and the resistance at 1.6921. Another support stands at 1.6732 (15/05/2014 low), whereas another resistance lies at 1.6996. In the longer term, prices continue to move in a rising channel. A bullish bias remains favoured as long as the support at 1.6661 (15/04/2014 low) holds. However, a major resistance stands at 1.7043 (05/08/2009 high).
USD/JPY: has successfully tested the strong support at 100.76. A break of the resistance area defined by the declining trendline (around 102.09) and 102.36 (13/05/2014 high) is needed to suggest something more than a short-term bounce. Hourly supports can be found at 101.60 (23/05/2014 low) and 101.35. A long-term bullish bias is favoured as long as the key support 99.57 (19/11/2013 low) holds. Monitor the support area provided by the 200 day moving average (around 101.26) and 100.76 (04/02/2014 low). A major resistance stands at 110.66 (15/08/2008 high).
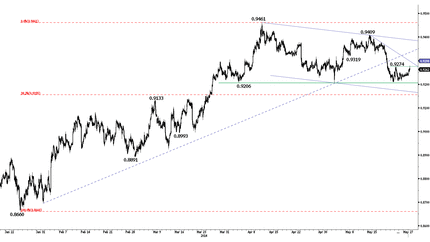
USD/CHF: has thus far failed to make a decisive daily close above the resistance at 0.8953. However, a bullish bias is favoured as long as the support at 0.8883 (15/05/2014 low) holds. Another resistance lies at 0.9038 (12/02/2014 high), whereas an initial support can be found at 0.8924 (22/05/2014 low). From a longer term perspective, the structure present since 0.9972 (24/07/2012) is seen as a large corrective phase. A decisive break of the key resistance at 0.8953 is needed to validate a bullish reversal pattern (see potential double-bottom formation).

