
: 34.8%
VIX Status: 16.6
General (Short-term) Trading Call: Play the wedge breakout (go long)
Active T2108 periods: Day #1 under 40% (underperiod), Day #19 under 70% (underperiod)
Commentary
The early breakout from the wedge pattern on the S&P 500 turned out to be premature. The Federal Reserve’s latest decision on monetary policy caused the market to recoil and reverse all of the week’s (2 days worth) gains.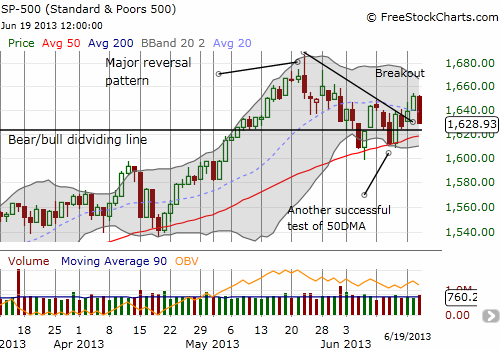
The 1.4% loss on the S&P 500 brought the index right back to the top of the former wedge pattern. This is a juncture featuring a convergence of three points of support: the former downtrend line, the former bear/bull dividing line at 1623, and the 50-day moving average (DMA). Adding to the drama is a tremendous plunge in T2108 from 43.7% to 34.8%. Another decline on Thursday (June 20) will deliver quasi-oversold conditions. Even if a quasi-oversold condition fails to deliver a bounce on Friday (June 21), classic oversold conditions will be right around the corner (T2108 < 20%). Moreover, Friday is a major options expiration day. In other words, it appears that more dramatic moves lay ahead.
In another case of "you just cannot make this stuff up," the volatility index, the VIX, made a picture-perfect bounce off support (the pivot around 15.2). 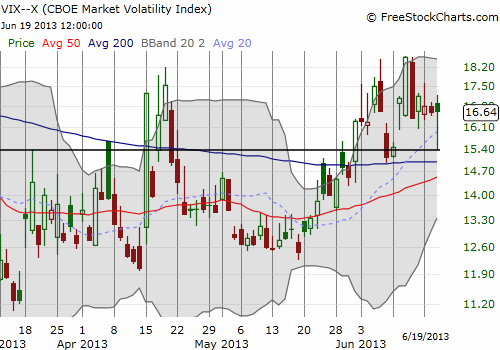
The fresh resilience of the VIX is my main source of caution. The VIX has not been this resilient since the second half of 2012. I was anticipating a large plunge in the VIX after the uncertainty of the Fed was placed in the readview mirror. This picture-perfect bounce must now represent part of a growing wariness and expectation of a summer sell-off. Certainly adding to these fears is the on-going creep in bond yields. For example, the iShares Barclays 20-Year Treasury Bond Fund (TLT) is now at 14-month lows (low prices equal high yields). Higher bond yields will be interpreted as bad for stocks in general and very bad for cyclicals and other rate-sensitive sectors…even if the ultimate implication of higher yields is a material improvement in the prospects for the economy.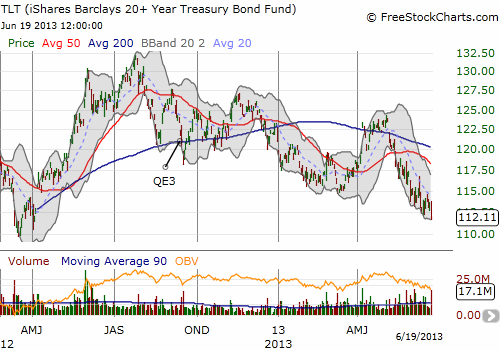
Through it all, I am maintaining a bullish bias. If the S&P 500 avoids another day of selling, I will keep my powder dry. In that scenario, the bulls will next need to make a new high above Tuesday’s breakout level to convince me they have staying power. I would greatly prefer to buy on oversold conditions since at that point the bears will likely over-reach in chasing the market lower. Regardless, this is a time for traders to stay alert, remain vigilant, and, most importantly, be careful out there!
Black line: T2108 (measured on the right); Green line: S&P 500 (for comparative purposes)
Red line: T2108 Overbought (70%); Blue line: T2108 Oversold (20%)
Be careful out there!
Full disclosure: long TLT puts, long TBT
- English (UK)
- English (India)
- English (Canada)
- English (Australia)
- English (South Africa)
- English (Philippines)
- English (Nigeria)
- Deutsch
- Español (España)
- Español (México)
- Français
- Italiano
- Nederlands
- Português (Portugal)
- Polski
- Português (Brasil)
- Русский
- Türkçe
- العربية
- Ελληνικά
- Svenska
- Suomi
- עברית
- 日本語
- 한국어
- 简体中文
- 繁體中文
- Bahasa Indonesia
- Bahasa Melayu
- ไทย
- Tiếng Việt
- हिंदी
Early Breakout Suffers Prompt Reversal
Published 06/20/2013, 07:36 AM
Updated 07/09/2023, 06:31 AM
Early Breakout Suffers Prompt Reversal
T2108 Status
3rd party Ad. Not an offer or recommendation by Investing.com. See disclosure here or
remove ads
.
Latest comments
Install Our App
Risk Disclosure: Trading in financial instruments and/or cryptocurrencies involves high risks including the risk of losing some, or all, of your investment amount, and may not be suitable for all investors. Prices of cryptocurrencies are extremely volatile and may be affected by external factors such as financial, regulatory or political events. Trading on margin increases the financial risks.
Before deciding to trade in financial instrument or cryptocurrencies you should be fully informed of the risks and costs associated with trading the financial markets, carefully consider your investment objectives, level of experience, and risk appetite, and seek professional advice where needed.
Fusion Media would like to remind you that the data contained in this website is not necessarily real-time nor accurate. The data and prices on the website are not necessarily provided by any market or exchange, but may be provided by market makers, and so prices may not be accurate and may differ from the actual price at any given market, meaning prices are indicative and not appropriate for trading purposes. Fusion Media and any provider of the data contained in this website will not accept liability for any loss or damage as a result of your trading, or your reliance on the information contained within this website.
It is prohibited to use, store, reproduce, display, modify, transmit or distribute the data contained in this website without the explicit prior written permission of Fusion Media and/or the data provider. All intellectual property rights are reserved by the providers and/or the exchange providing the data contained in this website.
Fusion Media may be compensated by the advertisers that appear on the website, based on your interaction with the advertisements or advertisers.
© 2007-2024 - Fusion Media Limited. All Rights Reserved.