
DXP Enterprises, Inc. (NASDAQ:DXPE) reported impressive bottom-line results for fourth-quarter 2017. Since the release on Mar 20, 2018, its shares have rallied 26.6%.
Earnings in the quarter came in at 36 cents per share, including 7 cents per share of provisional benefit from lower taxes related to the U.S. tax reform and 12 cents of other one-time gains. Excluding the gain from the tax reform, the quarterly result was 29 cents, surpassing the Zacks Consensus Estimate of 7 cents. However, the bottom line fell short of the year-ago tally of 42 cents.
For 2017, the company’s earnings were 93 cents per share, above 49 cents recorded in 2016. Excluding the above-mentioned one-time gains of 19 cents, the annual bottom-line result is 74 cents.
Solid Segmental Performance Drives Revenues
In the fourth quarter, DXP Enterprises’ revenues totaled $265.6 million, increasing 19.5% year over year and 5.6% above the Zacks Consensus Estimate of $252 million.
The company reports its revenues under three heads/segments. The segmental results for the fourth quarter are briefly discussed below:
Revenues from Service Centers segment totaled $167 million, up 19.5% year over year.
Revenues from Innovative Pumping Solutions segment grew 30.7% year over year to $59.5 million.
Revenues from Supply Chain Services segment were $39.2 million, up 5.6% year over year.
For 2017, its revenues were 1,006.8 million, above $962.1 million generated in the previous year. Organic revenues in the year grew 7.2%.
Margins Fall on Higher Costs & Expenses
In the quarter, DXP Enterprises’ cost of sales decreased 20.2% year over year, representing 73.2% of revenues compared with 72.8% in the year-ago quarter. Gross margin decreased 40 basis points year over year to 26.8%. Selling, general and administrative expenses as a percentage of revenues were 23.6% compared with 23.8% recorded in the year-ago quarter.
Adjusted earnings before interest, tax, depreciation and amortization (EBITDA) were $16.1 million, down 28.2% year over year. EBITDA margin was 6.1% versus 10.1% in the fourth quarter of 2016.
Balance Sheet and Cash Flow
Exiting the fourth quarter, DXP Enterprises had a cash balance of $25.6 million versus $23.1 million in the previous quarter. Net debt in the quarter was $226.5 million.
In 2017, the company generated net cash of $12.5 million from its operating activities, down from $48 million in the previous year. Capital spending totaled $2.8 million, decreasing 42.3% year over year.
Outlook
For 2018, DXP Enterprises intends on strengthening its products and services, enhancing operational efficiency, expanding business through meaningful acquisitions and rewarding shareholders handsomely.
The effective tax rate for the year is predicted to be 28-30%.
DXP Enterprises, Inc. Price, Consensus and EPS Surprise
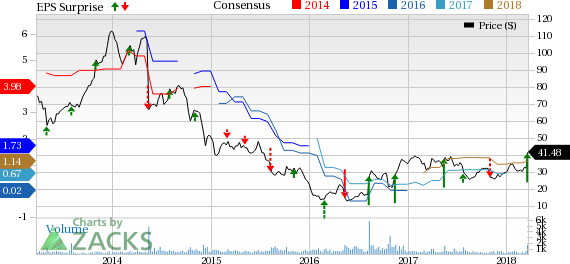
DXP Enterprises, Inc. Price, Consensus and EPS Surprise | DXP Enterprises, Inc. Quote
Zacks Rank & Stocks to Consider
With a market capitalization of approximately $721 million, DXP Enterprises currently carries a Zacks Rank #3 (Hold).
Some better-ranked stocks in the industry are Dover Corporation (NYSE:DOV) , Graco Inc. (NYSE:GGG) and Applied Industrial Technologies, Inc. (NYSE:AIT) . While Dover and Graco sport a Zacks Rank #1 (Strong Buy), Applied Industrial carries a Zacks Rank #2 (Buy). You can see the complete list of today’s Zacks #1 Rank stocks here.
In the last 60 days, earnings estimates for each of these stocks improved for the current year and the next year. Also, average positive earnings surprise for the last four quarters were 7.26% for Dover, 18.54% for Graco and 10.97% for Applied Industrial.
Looking for Stocks with Skyrocketing Upside?
Zacks has just released a Special Report on the booming investment opportunities of legal marijuana.
Ignited by new referendums and legislation, this industry is expected to blast from an already robust $6.7 billion to $20.2 billion in 2021. Early investors stand to make a killing, but you have to be ready to act and know just where to look.
See the pot trades we're targeting>>
Dover Corporation (DOV): Free Stock Analysis Report
Applied Industrial Technologies, Inc. (AIT): Free Stock Analysis Report
Graco Inc. (GGG): Free Stock Analysis Report
DXP Enterprises, Inc. (DXPE): Free Stock Analysis Report
Original post
Zacks Investment Research