Dow Jones Industrial Average climbs back into over loved, overly bullish territory.
The Dow Jones Industrial Average (DIA) remains extremely overvalued by historical standards that place it near extremes and significant market tops like 1929, 2000 and 2007.
The Dow Jones Industrial Average (DIA) remains extremely overvalued by historical standards that place it near extremes and significant market tops like 1929, 2000 and 2007.
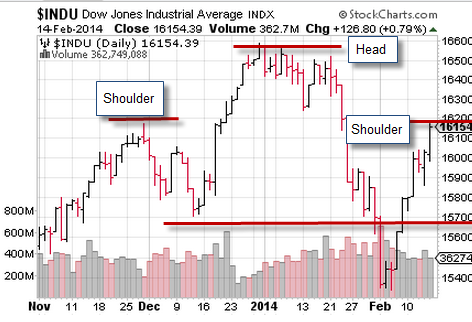
Last week’s rally brings the index back into significant resistance levels which must be superseded for the bull market to resume. We have been in this condition for sometime now without a corresponding return to “normal,” however, that doesn’t mean that “normal” won’t return. Rather, these ongoing postponements usually serve to make the return more painful and severe when it comes.
Nevertheless, for the short term, major U.S. indexes are in a strong uptrend with the % of stocks above their 50 day moving average at 65%, up from 35% at the beginning of February. The % of stocks above their 200 day moving average has risen to 71%, up from 56%, but well below the all time high of 83% seen in early 2013.
On My Stock Market Radar
The chart of the Dow Jones Industrial Average (DIA) shows that the recent rally has been sharp and significant and brings the index back to resistance and levels that will challenge recent highs.
It also demonstrates what some analysts see as a building head and shoulders pattern while others point to “The Scary Chart” and the correlation between today’s patterns and 1929.

Last week brought a very powerful rally off recent lows in the face of relatively weak economic and earnings reports but comforting testimony from new Fed Chair, Janet Yellen.
For the week, the SPX500 (SPY) gained 2.3%, the Dow Jones Industrial Average (DIA) added 2.3% and the Nasdaq Composite (QQQ) climbed 2.9%.
The action leaves major indexes just below record highs, but still in overbought conditions.
On a valuation basis, the SP 500 (SPY) has only been more expensive in 1929, 2000 and 2007, all of which were, of course, major market tops.
Nevertheless, investors cheered the Nasdaq closing at its highest level in 14 years.
Economic reports were mostly mixed with weekly jobless claims rising and missing expectations, January retail sales falling sharply, along with industrial production. The University of Michigan consumer sentiment index remained unchanged from last month’s level.
Next week brings a string of important reports after the long holiday weekend:
Tuesday: February Empire State Index, February home builder’s indes
Wednesday: January housing starts, FOMC meeting minutes
Thursday: weekly unemployment claims, January leading indicators, February Philadelphia Federal Reserve report.
Bottom line: A powerful rally brings the Dow Jones Industrial Average (DIA) and other U.S. indexes close to all time highs, into significantly overbought levels and facing significant overhead resistance ahead.
Disclaimer: The content included herein is for educational and informational purposes only, and readers agree to Wall Street Sector Selector's Disclaimer, Terms of Use, and Privacy Policy before accessing or using this or any other publication by Wall Street Sector Selector or Ridgeline Media Group, LLC.
