US Equity market continued to move in high volatile environment. In this kind of situation one can get carried away at the highs or can create panic exactly at the lows. Hence application of objective tools is important to trade the markets.
We have been applying Elliott wave theory along with basic technical analysis to capture the markets. Recently we were able to capture the down move from 18100 to 17265 levels. “The Global Waves Short Term Update”by Waves Strategy Advisors cover Dow Jones Industrial Average, EUR/USD, Comex gold and Comex silver with applied Elliott wave counts and important turning points.
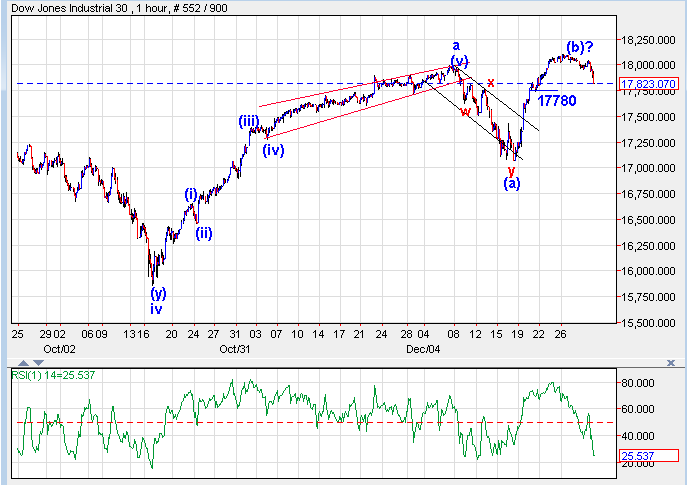
Dow 60 mins chart:(Anticipated in the evening of 2nd January, 2014)
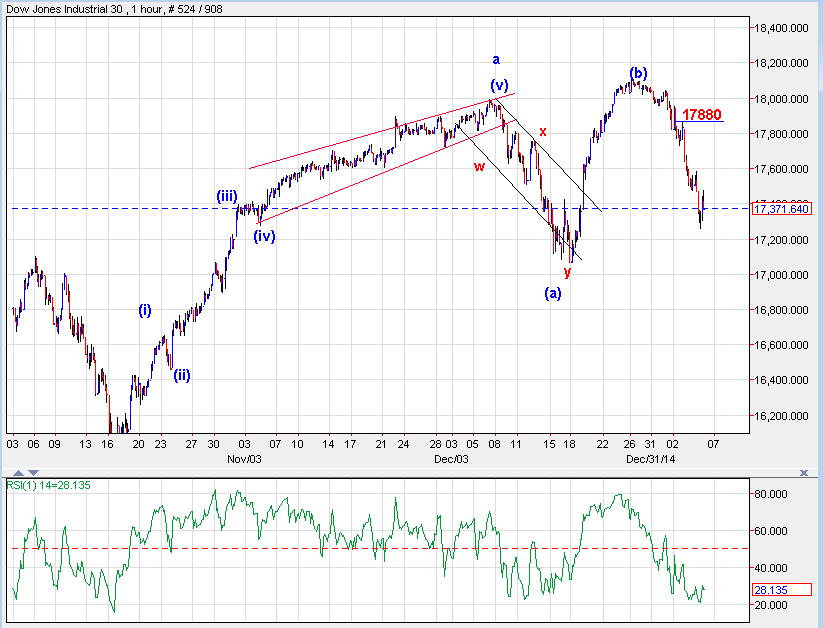
DJIA 60 mins chart:

Wave Analysis:
For Dow Jones Industrial Average, in the last 2 trading session prices showed weakness and has been moving lower sharply. This suggests that rally started from 17050 level is complete at 18100 levels and correction on downside has started.
“Basic techniques like channeling continued to work very well on Dow Jones Industrial Average. We can see that since September 2013 prices are intact in upward moving channel as shown in black color. Recently prices found resistance at the same channel and has been moving lower. So from short term perspective, as long as high of 18100 is protected on upside trend is bearish now. Prices made a new high at 18100 however RSI was unable to make new highs which suggests negative divergence and has been losing strength on upside.”
On 60 min basis, the sharp fall in the previous trading session raises higher probability that may be wave b has completed and the next leg (wave c) has started on downside but we will have to wait for the move below 17780 levels in order to get confirmation of the same. Hence as long as prices sustain below previous peak trend will be negative and any pullback towards the same should be utilized as selling opportunities.
The Global Waves Short Term Update gives detailed analysis on DJIA, EUR/USD, Comex Gold and Comex Silver. Visit www.wavesstrategy.com.In short, for Dow Jones Industrial Average, near term trend will be negative with the important resistance of previous high (18100) levels. Move below 17780 levels will suggest down move to continue towards 17300 levels.
Happened: US Equity Market moved in line with our expectation and moved lower from 18000 to 17262 in 4 trading sessions. Post that prices have reversed on upside so what to expect now? Will it crack 18100 on upside?
