Dow Jones Industrial Average sets new record close after a volatile week.
Charles Dow
The Dow Jones Industrial Average (DIA) added 167 points on Friday to close at 15,761 while the S&P 500 (SPY) gained 0.5% for the week to close just below record highs.
The Nasdaq Composite (QQQ) slid 0.1% week over week while the Russell 2000 (IWM) index of small cap stocks added 0.4% on the week.
On My Stock Market Radar
The Dow Jones Industrial Average (DIA) and other major U.S. stock indexes continue to levitate higher in spite of increasing volatility and a sharp sell off on Thursday. The market is becoming rather bi-polar as indexes diverge and economic news becomes contradictory as Friday’s jobs report came in much stronger than expected while consumer sentiment fell to a two year low and broadly missed expectations.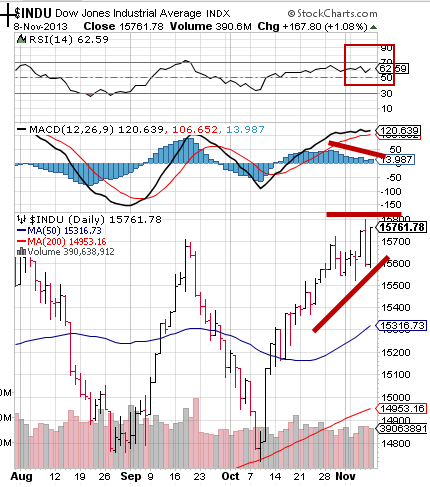
The volatile and confused action can be seen in the chart of the Dow Jones Industrial Average (DIA) as it took a big sell off on Thursday, followed by a huge rally on Friday but still remains below recent highs. RSI indicates that the average is near overbought levels while momentum as represented by MACD shows a negative divergence as MACD declines but prices continue to rise.
Many other cautionary indications continue to litter the landscape:
1. Major financial figures, including most recently, Laurence Fink, CEO of Blackrock, have expressed concerns that the market is becoming “bubble-like” or “frothy” and that the Federal Reserve needs to curtail its asset buying program to avoid a dangerous asset bubble.
2. According to the American Association of Individual Investors, as of October 30, the AAII Investor Sentiment Survey indicated that 44.97 percent of AAII members were feeling bullish about the stock market, while only 21.48 percent considered themselves bearish. 33.56 percent of AAII members had a neutral outlook about the direction of the market.
According to Investors Intelligence, as of October 29, 52.6 percent of the surveyed investors were bullish and only 16.5 percent were bearish, resulting in a bull/bear ratio of 3.19. The bull/bear ratio has not been above 3 since 2011.
Is the fact that stock market bears have become an endangered species a contrarian indicator? Many commentators believe so, comparing the situation to the “magazine cover indicator,” which is based on the notion that by the time a major business magazine focuses on a stock market rally – it is usually too late.
Bulls outnumber bears by a large percentage and the last time levels like this were reached the S&P 500 (SPY) fell nearly 10% between April and June, 2012.
3. Fundamentals aren’t that great. According to John Butters at Factset Research Systems, as of November 1, 79 of the companies in the S&P 500 Index had issued earnings guidance for the fourth quarter of 2013. Of these 79 companies, 66 had issued negative earnings guidance and only 13 had issued positive earnings-per-share guidance. As a result, the percentage of companies issuing negative guidance for the fourth quarter of 2013 (as of November 1) is 84 percent. The 5-year average for the percentage of companies issuing negative earnings guidance is only 63 percent. From this perspective, it appears that fourth quarter earnings could be ugly which could put further downwards pressure on stocks.
4. The ongoing flood of money from retail investors coming into the market, at the highest levels since 2000, and insiders selling at elevated levels are both notorious indicators of impending market tops.
5. Market breadth remains weak, indicating a lack of conviction among buyers.
Stock Market News You Can Really Use
The big news on Friday was the monthly unemployment report which indicated that the economy had added 204,000 jobs in October, soundly beating analysts’ expectations. However, the overall unemployment rate ticked higher from 7.2% to 7.3% as people continued leaving the job market.
Market participants couldn’t seem to decide if good news was good or if good news was bad as futures and major indexes swung lower in early action but then kicked into gear to close solidly higher as the rally gained strength during the day.
People are still trying to figure out if the Fed might taper its bond buying program in December or wait until March, and Friday’s mixed bag of reports didn’t do anything to help clear up the picture. Even the Fed described the picture as muddled as Atlanta Fed President Dennis Lockhart called the current economic environment “murkier than I would like.”
Overseas, things were less murky as stocks declined and Standard and Poor’s cut France’s credit rating to “AA.”
Japanese stocks sank on Friday with the Nikkei losing 1%. (EWJ).
In China, stocks continued to decline as investors remained anxious about the economic policy meeting scheduled for November 9-12 in Beijing. The fear factor outweighed a surprising report from the General Administration of Customs that China’s exports increased by 5.6 percent in October on a year-over-year basis, beating economists’ expectations for a 1.7 percent rise. The Shanghai Composite Index sank 1.09 percent to 2,106 (FXI). Hong Kong’s Hang Seng Index dropped 0.60 percent to end the day at 22,744 (EWH).
At home, bond yields jumped with the ten year Treasury (IEF) jumping to 2.75% from Thursday’s close of 2.61%.
Bottom line: Investors continue to buy the dip and remain complacent, even euphoric, while risk and market extremes reach historic levels and noted experts sound dire warnings. The game will continue until it ends which could be sooner than most people expect.
Disclaimer: The content included herein is for educational and informational purposes only, and readers agree to Wall Street Sector Selector's Disclaimer, Terms of Use, and Privacy Policy before accessing or using this or any other publication by Wall Street Sector Selector or Ridgeline Media Group, LLC.
- English (UK)
- English (India)
- English (Canada)
- English (Australia)
- English (South Africa)
- English (Philippines)
- English (Nigeria)
- Deutsch
- Español (España)
- Español (México)
- Français
- Italiano
- Nederlands
- Português (Portugal)
- Polski
- Português (Brasil)
- Русский
- Türkçe
- العربية
- Ελληνικά
- Svenska
- Suomi
- עברית
- 日本語
- 한국어
- 简体中文
- 繁體中文
- Bahasa Indonesia
- Bahasa Melayu
- ไทย
- Tiếng Việt
- हिंदी
Dow Jones Gains On Volatile Week
Published 11/10/2013, 06:43 AM
Updated 05/14/2017, 06:45 AM
Dow Jones Gains On Volatile Week
Latest comments
Loading next article…
Install Our App
Risk Disclosure: Trading in financial instruments and/or cryptocurrencies involves high risks including the risk of losing some, or all, of your investment amount, and may not be suitable for all investors. Prices of cryptocurrencies are extremely volatile and may be affected by external factors such as financial, regulatory or political events. Trading on margin increases the financial risks.
Before deciding to trade in financial instrument or cryptocurrencies you should be fully informed of the risks and costs associated with trading the financial markets, carefully consider your investment objectives, level of experience, and risk appetite, and seek professional advice where needed.
Fusion Media would like to remind you that the data contained in this website is not necessarily real-time nor accurate. The data and prices on the website are not necessarily provided by any market or exchange, but may be provided by market makers, and so prices may not be accurate and may differ from the actual price at any given market, meaning prices are indicative and not appropriate for trading purposes. Fusion Media and any provider of the data contained in this website will not accept liability for any loss or damage as a result of your trading, or your reliance on the information contained within this website.
It is prohibited to use, store, reproduce, display, modify, transmit or distribute the data contained in this website without the explicit prior written permission of Fusion Media and/or the data provider. All intellectual property rights are reserved by the providers and/or the exchange providing the data contained in this website.
Fusion Media may be compensated by the advertisers that appear on the website, based on your interaction with the advertisements or advertisers.
© 2007-2024 - Fusion Media Limited. All Rights Reserved.