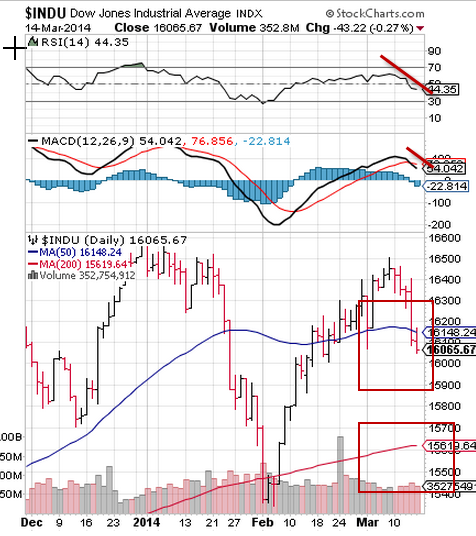
For the week, the Dow Jones Industrial Average (DIA) fell 2.4%, falling on all five trading days and dropping below the widely watched 50 day moving average. Worries over an economic slowdown in China and the ongoing fluid situation in Crimea added to market worries. Other factors were overbought conditions, excessive margin debt which tends to accelerate selling when it occurs and tepid economic reports.
The SP500 (SPY) dropped 2% for the week, falling below the psychologically important 1850 level and the Nasdaq (QQQ) declined 2.1%.
On My Stock Market Radar
A quick glance at the chart of the Dow Jones Industrial Average (DIA) tells the story. Relative strength and momentum are in decline and the average fell below the blue 50 day moving average. A few areas of support are just below current levels with the 200 day moving average, widely viewed as the demarcation line between bull and bear markets, roughly 2.5% below current levels.
The change in slope on the 50 day and 200 day moving averages is also apparent as the index continues its decline from recent highs.

Other factors currently at work include:
1. The Federal Reserve taper which is likely to affect markets as liquidity continues to be withdrawn from the markets.
2. Overvaluation: Several methodologies indicate that the current U.S. stock market is significantly overvalued, possibly by as much as 50% according to Nobel Prize winner Robert Shiller’s Cyclically Adjusted Price/Earnings Ratio (CAPE) and Nobel Prize winner James Tobin’s Q Ratio. Dr. Shiller’s P/E is at levels only exceeded before Black Tuesday in 1929, the dot.com bust in 2000 and the onset of the financial crisis in 2007.
3. China: The dragon remains a wild card as its economy continues to slow, the country faces a potential “derivatives time bomb” and the Shanghai composite is still more than 60% below its 2007 high.
4. The calendar: Time is working against this bull which just celebrated its fifth birthday. As bulls age, corrections become more frequent and deeper until the bull inevitably dies. Also March is the scene of a significant market top (March, 2000) and not far on the horizon is the “sell in May and go away” time of year.
5. Record margin debt: Margin debt is now at all time highs, and record margin debt levels are typically associated with market tops (March, 2000, June 2007) as investors go all in and continue to “buy the dip” in search of easy profits.
6. Insider Selling: Company insiders are bearish with February seeing the highest ratio of insider selling to buying in a year. Insiders have a bird’s eye view of their companies’ future fortunes and so their actions are oftentimes valid forecasts of price action to come.
Last week’s economic reports were mixed with weekly jobless claims falling and February retail sales climbing 0.3% and beating expectations.
Producer prices fell and University of Michigan consumer sentiment for March fell to 79.9 and dropping from 81.6 the previous month.
Next week will see a number of important economic reports and developments:
Monday: MarchEmpireState Index, February Industrial Production, March Home builder’s index.
Tuesday: February housing starts and building permits.
Wednesday: FOMC interest rate announcement and Janet Yellen’s first press conference as Federal Reserve Chair.
Thursday: Weekly unemployment claims, March Philadelphia Federal Reserve
In the upcoming week, Crimea will likely continue to send jitters through world markets, particularly in Europe, while China continues to rattle Asian markets and commodities, particularly copper (JJC) which is now down approximately 15% since the first of the year.
Key to future market direction will be the global reaction to Sunday’s vote in the Ukraine, and Janet Yellen’s words will be sliced and diced for clues as to her plans for interest rates and the ongoing tapering of the Fed’s quantitative easing program.
Bottom line: U.S. markets remain vulnerable to geopolitical problems, slowing economies around the world and technical factors which could set the stage for further selling. Red flag indicators point to further declines ahead.
Disclaimer: The content included herein is for educational and informational purposes only, and readers agree to Wall Street Sector Selector's Disclaimer, Terms of Use, and Privacy Policy before accessing or using this or any other publication by Wall Street Sector Selector or Ridgeline Media Group, LLC.
