There has been much commentary published as of late discussing when the Federal Reserve will begin raising interest rates. Generally, attached to the heels of that discussion, are comments suggesting that investors have nothing to fear from such an event. However, is that really the case?
Much of the case built behind the current financial market levitations, which has been a directly impacted of Federal Reserve interventions, has been: 1) low interest rates are supportive of higher valuations (aka Fed Model), 2) the yield curve (10 year - 3 month yield) is positive; and, 3) increases in interest rates lead to higher stock prices. Let's take a look at these three arguments in a bit of detail.
Low Interest Rates Support Higher Valuations
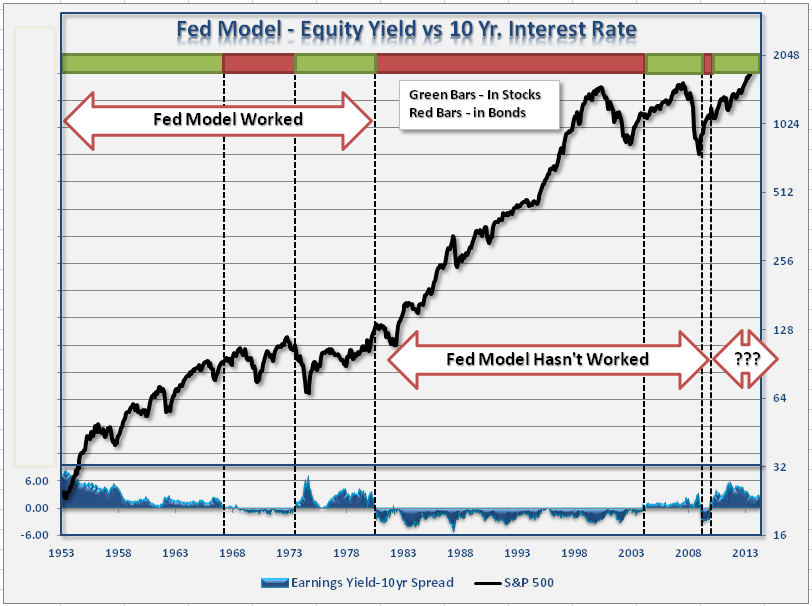
This theory is primarily built around a very flawed idea which has been dubbed "The Fed Model." The basic premise is that if the "earnings yield" of equities (the inverse of P/E - Earnings divided by Price (E/P) is higher than the interest yield of bonds, then investors should be in equities.
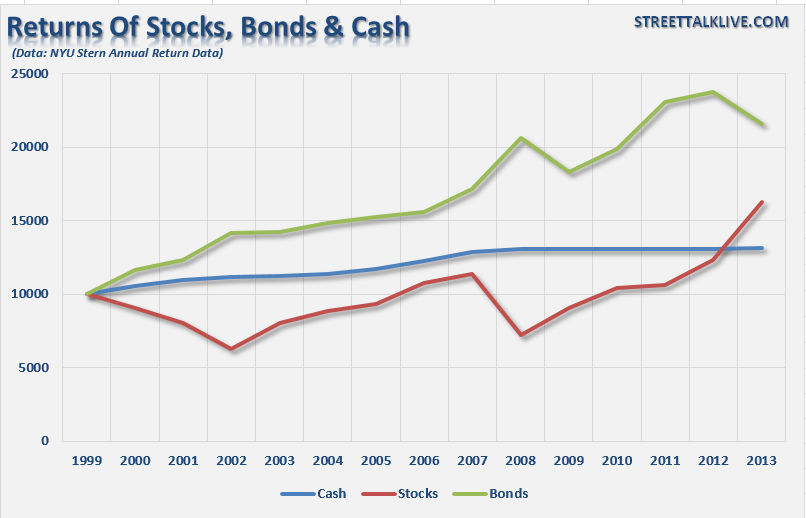
The problem here is twofold. First, you receive actual income from owning a Treasury bond, along with a return of principal function, whereas there is no tangible return from an earnings yield on stocks. Therefore, if I own a Treasury with a 5% yield and a stock with a 8% earnings yield, if the price of both assets do not move for one year - my net return on bond is 5% and on the stock it is 0%. Which one had the better return? This has been especially true since the turn of the century where stock performance has lagged bonds and cash (until just recently.) Yet, analysts keep trotting out this broken model to entice investors to chase one of the worst performing asset classes.
Secondly, as shown in the chart below, the Fed model worked from 1950-1980 as earnings yield was rising faster than lending rates. This was due to a rising trend in annual rates of economic growth which fostered higher levels of prosperity and personal savings rates. However, since 1980, the steady trend of falling annual rates of economic growth, inflation and interest rates broke the fundamental premise of the model. While the model appeared to work in 2004, it failed to get investors out of the market before they lost all of their gains and then some. It is yet to be proven that the current process will not end as badly.
Yield Curve Is Positive
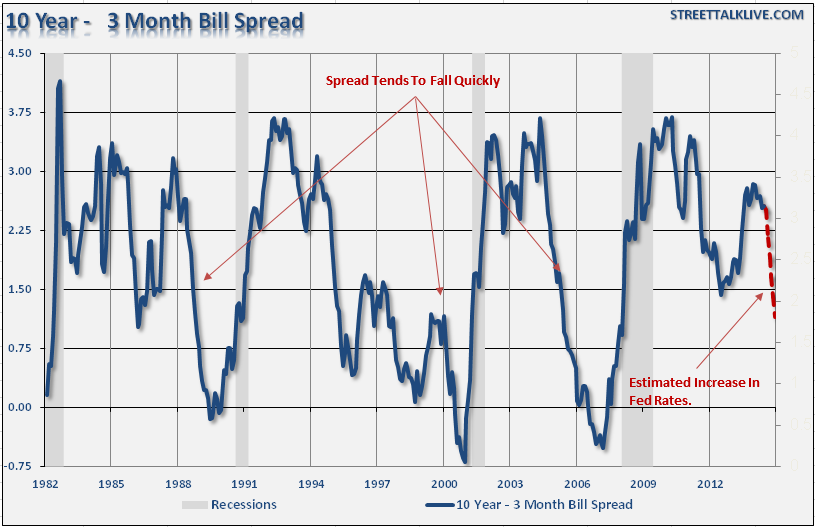
Another "bull market" indicator that has often been cited is the spread between the interest rates of the 10-Year treasury bond and 3-Month treasury bill (almost a perfect representation of the effective Fed Funds rate). Historically, when the spread between these two interest rates is positive it has been indicative of both a strengthening economic environment and rising asset prices. The opposite has also been true.
What the Fed giveth, the Fed taketh away. As shown in the chart below, the spread between these two rates falls quickly once the Fed begins increasing interest rates. The reason this happens is that the Fed can directly control what it charges to lend money to banks, however, the 10-year treasury rate is a function of market dynamics. Therefore, as the interest rates on the short end of the spectrum rise faster than the long end, the spread falls very quickly as the economy slows towards recession.
Currently, the yield spread suggests that the current "bull market" remains intact along with economic growth. However, as shown by the dashed red line in the chart below, this can change VERY quickly when the Fed begins hiking interest rates.
Rising Interest Rates Lead To Higher Stock Prices
This claim falls into the category of "timing is everything." The chart below has been circulated quite a bit to support the "don't fear rising interest rates" meme. I have annotated the chart to point out the missing pieces.
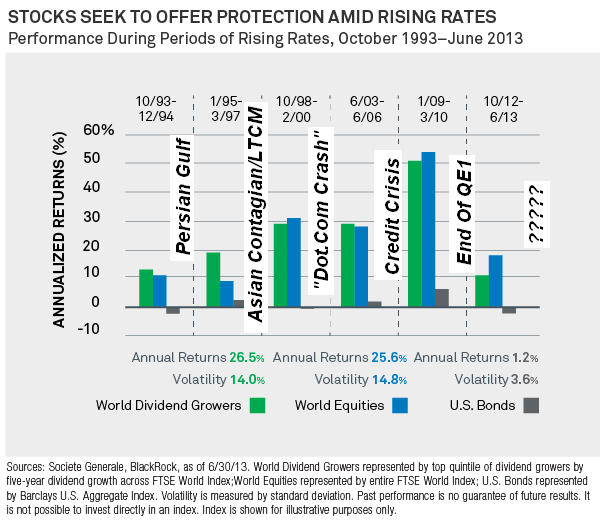
As I stated above, timing is everything. While rising interest rates may not "initially" drag on asset prices, it is a far different story to suggest that they won't. I addressed this issue previously in "Why Market Bulls Should Hope Interest Rates Don't Rise" wherein I pointed out twelve (12) reasons why rising interest rates are a problem, particularly when those rate increases are coming from a period of very low economic growth.
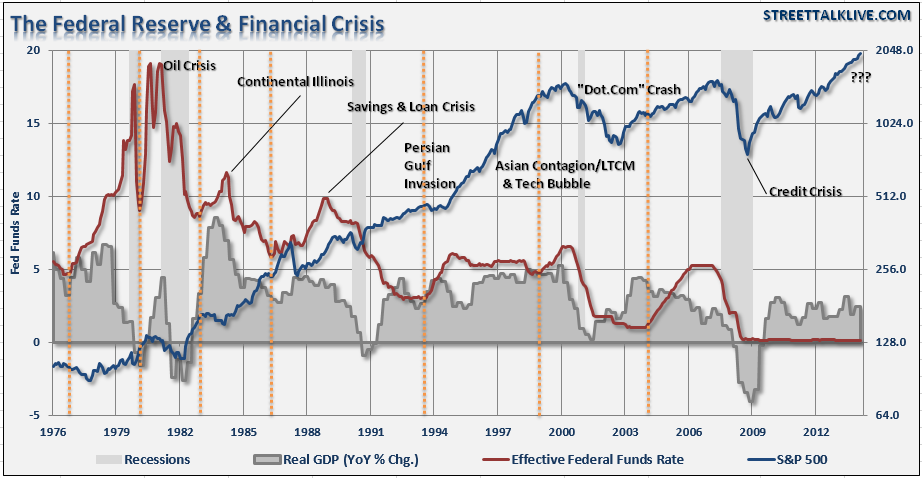
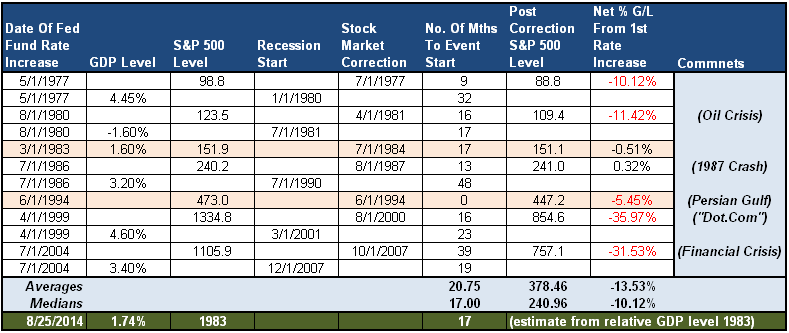
What the mainstream analysts fail to address is the "full-cycle" effect from rate hikes. The chart and table below address this issue by showing the return to investors from the date of the first rate increase through the subsequent correction and/or recession.
There are several things to take away from the table above:
1) There have been ZERO times that the Federal Reserve has entered into a rate hiking campaign that did not have a negative consequence.
2) Assuming a buy and hold investment, which never really occurs due to panic selling during declines, investors would have still netted a slightly positive return following the crash of 1987. However, having just been in cash during that entire period would have netted a higher overall compounded return.
3) The average period of time following an increase in the effective funds rate to either a stock market correction, economic recession or both has been 20.75 months. Therefore, if we assume an initial increase in the Fed funds rate in June of 2015, that would put the next negative event sometime in the first quarter of 2017.
4) However, the median number of months following the initial rate hike has been 17 months. This would advance the timeframe into mid-2016. Such a time frame would coincide with both the Decennial and Presidential cycles as discussed previously.
5) Importantly, there have been only two times in recent history that the Federal Reserve has increased interest rates from such a low level of annualized economic growth. The most relevant period was in 1983 when the economy was recovering from two adjacent recessions. Due to such weak economic growth, the impact of rising interest rates tripped up the stock market just 17 months later.
6) Lastly, it is crucially important to recognize that the ENTIRETY of the "bullish" analysis is based around a sustained 34-year period of falling interest rates, inflation and annualized rates of economic growth. With all of these variables near historic lows there is absolutely no way to assume how asset prices, or economic growth, will fair going forward.
What is clear from the analysis is that the net, full-cycle, return to investors has been dismal following the Federal Reserve's first interest rate increase. While it may initially seem that stocks can weather higher interest rates, it is only due to the fact that it requires 6-9 months before a rate hike impacts the economy. Much like a car hitting its brakes in traffic, as one rate hike compounds on the next, the eventual outcome is a complete traffic jam.
Should you fear rate hikes? Absolutely. However, as I stated earlier, "timing is everything." It is highly unlikely that with employment, consumption and global economies weak, the lag between the Fed's first rate hike and the next negative outcome will be very long. While the current cyclical bull market is still firmly intact, which keeps my allocation model almost fully invested, there is little to suggest that "this time is different."
For now the bullish trend is still in place which needs to be "consciously" honored. However, while it may seem that nothing can stop the markets currently, it is crucially important to remember that it is "only like this, until it is like that" and those "asleep at the wheel" will pay a heavy price when taillights turn red.

