Yellen, BoC to be this week’s highlights
The dollar weakened over the past week against most of the G10 currencies as the enthusiasm caused by the outsize nonfarm payrolls quickly faded, to be replaced by a more cautious view of what the Fed was likely to do. The May 2017 Fed Funds futures have lost all the post-NFP gains and are now 9 bps below where they were before the employment data came out. Given that speculation over Fed policy is dominating the dollar’s direction even more than the data, the highlight of the week will no doubt be the further clarification on Fed thinking from Fed Chair Janet Yellen when she delivers the twice-a-year report on monetary policy to Congress (the Senate on Tuesday and the House of Representatives on Wednesday).
The biggest gainer over the past week was NZD, which gained after ratings agency Fitch raised the country’s credit outlook to positive from stable and reaffirmed its AA rating.
On the other hand, CAD was the biggest loser. All the losses came on Friday after the country’s unemployment rate unexpectedly rose to 7.1% in June from 7.0% in the previous month. The Canadian economy lost 9.4k jobs last month, a big difference from the forecast of +20.0k jobs. The worse-than-expected figures were in contrast to the nation’s recent gains in retail sales, the RBC Canadian manufacturing PMI, and several housing indicators and confounded traders who were anticipating a more hawkish tone at this week’s Bank of Canada meeting. CAD had been firming recently on expectations that they would move from a neutral to a tightening bias, but I disagree; if anything, I expect them to take a more dovish stance to counter the recent strength of the currency (see my article, “The Market Could Be Shocked by the Bank of Canada,” at http://www.cnbc.com/id/101824413 ). Wednesday’s meeting is shaping up to be one of the main events of the week.
The EUR/USD moved a barely perceptible 0.2% over the week, which would be lackluster for even one day’s trading range.
There was more action in commodities. Silver gained 1.8% over the week and gold was not far behind. The two slipped early in the week as stock markets hit fresh highs, but then the problems in the Portuguese banking system erupted and they found a safe-haven bid. There is also talk in the market that the unwinding of Chinese commodity financing deals are squeezing the shorts in the two precious metals. This move was somewhat reversed Monday in Asia however. On the other hand, the increase in hostilities in the Middle East did nothing for oil and Brent was the biggest loser of the week, down 3.7% after Kurdish forces took over several of Iraq’s major oilfields and Libya reopened two oil-export terminals. The soft commodities too are getting hammered as cool weather ample rain in the US Midwest create excellent conditions for crops. Wheat lost 4.1% on Friday (-8.1% on the week), corn was down 2% on the day (-7.3% on the week) and soybeans fell for the 10th consecutive session.
Today: Monday’s calendar is relatively light. In the absence of any major European indicators, attention will focus once again on the situation in Portugal and the performance of European bank stocks. ECB President Mario Draghi testifies to the EU Parliament’s economic and monetary committee, but his views are well known and he is unlikely to say anything market-moving.
During the European day, Eurozone’s industrial production is expected to have fallen in May on a mom basis, the biggest drop surveyed by Bloomberg since September 2012. The drop in the single-currency bloc follows the steep decline of German industrial output announced last Monday and will probably weaken the euro as it confirms a broad slowdown in the Eurozone’s recovery.
There are no indicators coming from the US
This week: On Tuesday, during the Asian morning, the RBA releases the minutes of its latest monetary policy meeting. There were no significant changes in the statement following the meeting, so we doubt whether the minutes will show any great divergences in view. The main event during the European day will be the German ZEW survey for July. The current situation index and the expectations index are expected to decline, which would add to the recent nervousness about the Eurozone recovery. In the UK, we get CPI and PPI data for June. From the US, we get the Empire State manufacturing survey for July and retail sales for June, along with Fed Chair Yellen’s first testimony. On Wednesday, we have China’s 2Q GDP, which is expected to show growth continued at the same pace in Q2 as in Q1, and Australia’s Westpac consumer confidence index for June. From the UK, we get the unemployment rate for May, which is expected to decline further. That could help turn around sentiment towards the pound, which has cooled recently as various indicators have come in softer. During the European day, the Riksbank releases the minutes from its latest policy meeting, when it shocked the markets by cutting rates more than expected. In the US, industrial production and the National Association of Home Builders (NAHB) market index are coming out, both for June. In Canada, the Bank of Canada meets to decide on its interest rates. On Thursday, we have Eurozone’s final CPI for June, while from the US we get housing starts and building permits for the same month. We also have the Philadelphia Fed business activity index for July. Finally on Friday, we get Eurozone’s current account balance for May, the US U of M preliminary confidence sentiment for July and Canada’s CPI for June.
The Market
EUR/USD in a consolidative mode
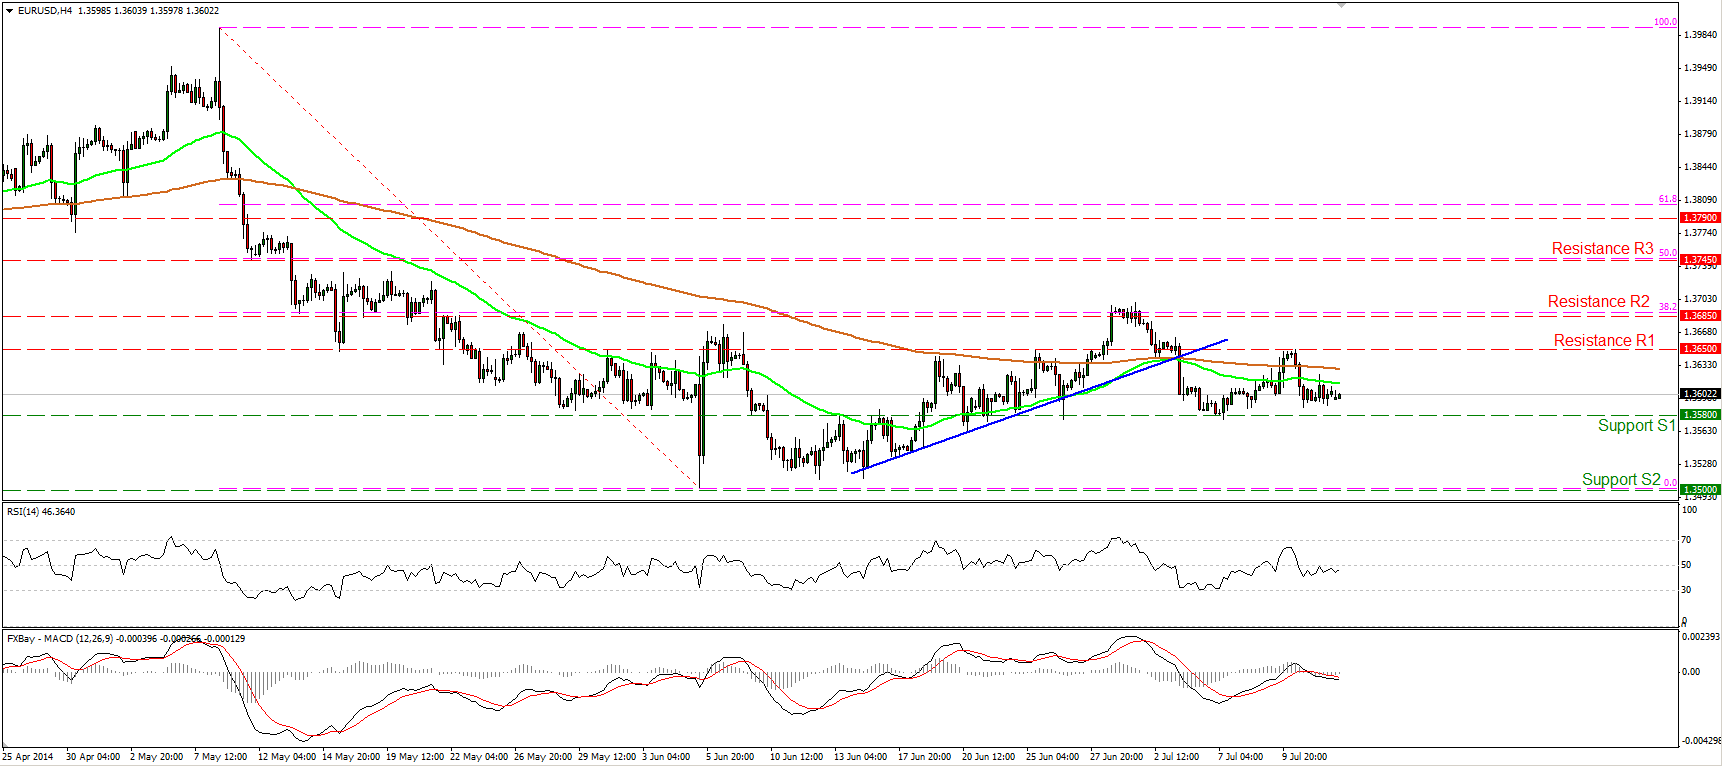
EUR/USD moved in a consolidative mode on Friday remaining between the support zone of 1.3580 (S1) and the two moving averages. With that in mind and the fact that both the 50- and the 200-period moving averages are pointing sideways, I would maintain my neutral stance for now. Only a dip below the 1.3580 (S1) could confirm a forthcoming lower low and trigger further bearish extensions. I would expect such a dip to pave the way towards the psychological barrier of 1.3500 (S2). On the daily chart, both the 14-day RSI and the daily MACD lie near their neutral levels, supporting my flat view, at least for now.
• Support: 1.3580 (S1), 1.3500 (S2), 1.3475 (S3).
• Resistance: 1.3650 (R1), 1.3685 (R2), 1.3745 (R3).
EUR/JPY remains below 138.00
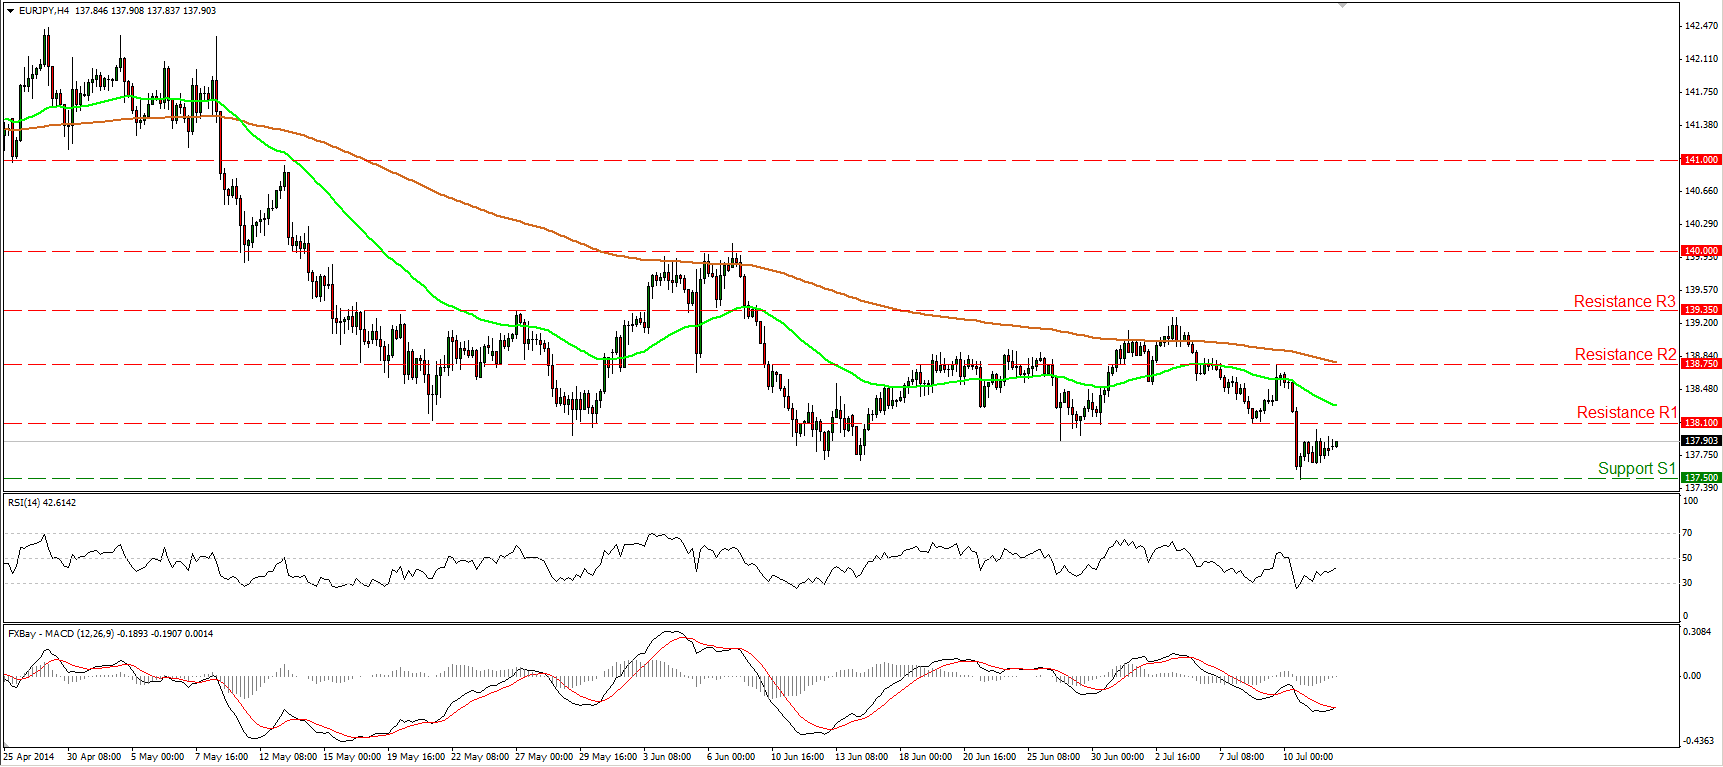
The EUR/JPY moved in consolidation, remaining between the support barrier of 137.50 (S1) and the resistance of 138.10 (R1). The RSI is pointing up and could challenge its 50 level in the near future, while the MACD is ready to move above its trigger line. Thus, further consolidation or an upside wave are likely for now. However, since the rate remains below the moving averages and the possibility for a lower high still exist, I still believe that the short-term outlook remains mildly to the downside. On the daily chart, I cannot identify a clear trending structure, thus I would consider the longer-term path of EUR/JPY to be to the sideways. Moreover, the price oscillates between the 50- and the 200-day moving average, which are pointing sideways, corroborating my neutral view as far as the long-term picture is concerned.
• Support: 137.50 (S1), 136.75 (S2), 136.20 (S3).
• Resistance: 138.10 (R1), 138.75 (R2), 139.35 (R3).
GBP/USD not choosing a direction
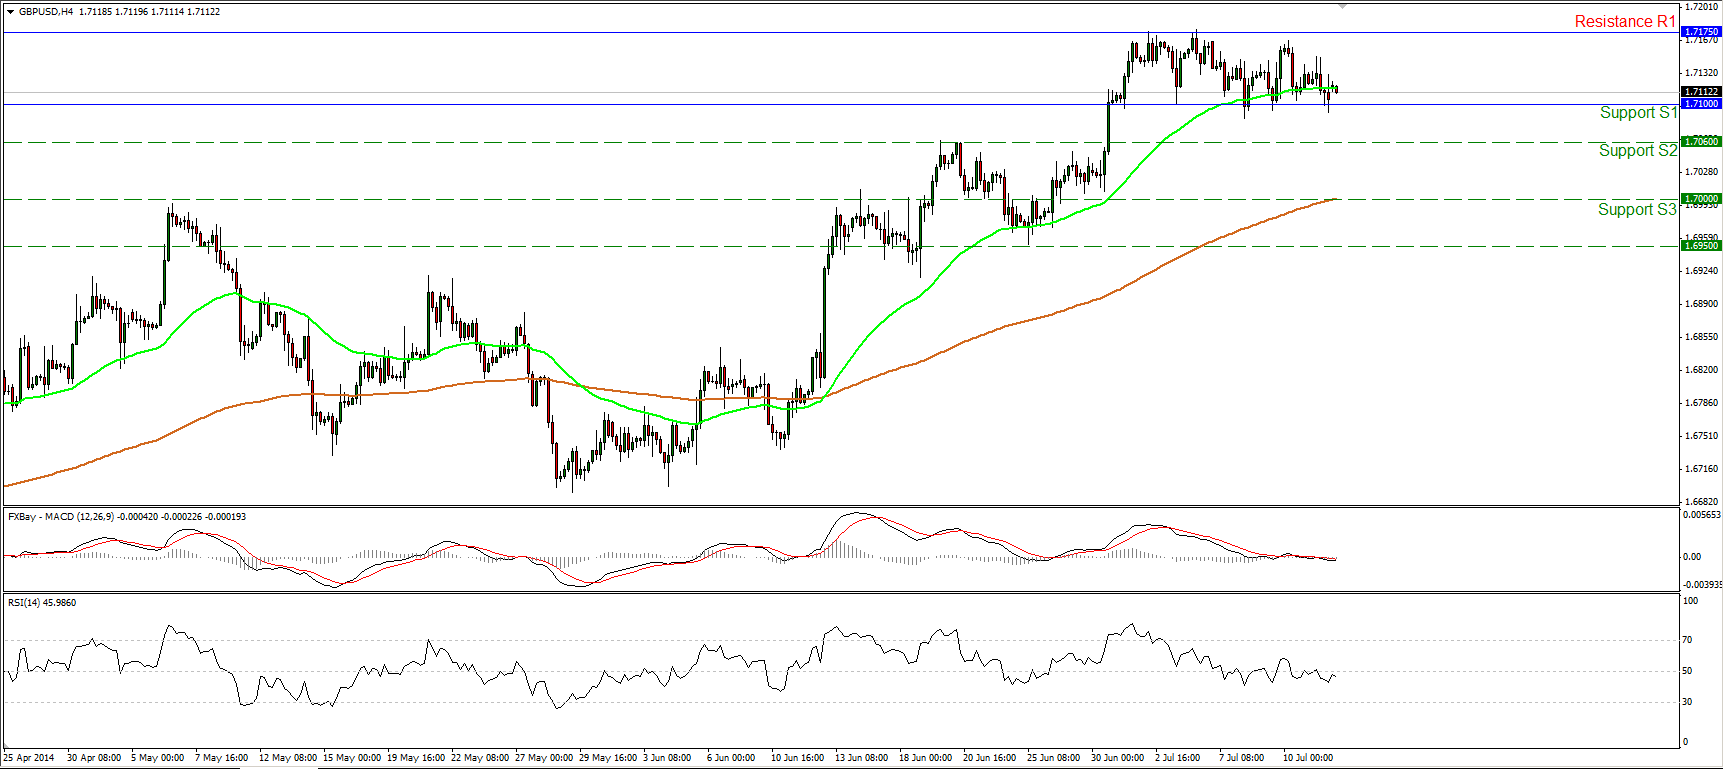
The GBP/USD moved slightly lower but the decline was stopped once again by the 1.7100 (S1) zone. I would retain my flat view, since the rate has been trading between that support and the resistance of 1.7175 (R1) since the 30th of June. A move above the 1.7175 (R1) hurdle would confirm a forthcoming higher high and signal the continuation of the prevailing uptrend, while a dip below the 1.7100 (S1) zone could trigger further correction. In the bigger picture, the daily MACD touched its toe below its signal line while the 14-day RSI moved lower after exiting its overbought territory. This gives more odds for a move below 1.7100 (S1). Nonetheless, the 80-day exponential moving average provides reliable support to the lows of the price action, keeping the long-term path to the upside. As a result, I would consider any future declines as a correcting phase of the longer-term uptrend.
• Support: 1.7100 (S1), 1.7060 (S2), 1.7000 (S3).
• Resistance: 1.7175 (R1), 1.7200 (R2), 1.7300 (R3).
Gold pulls back
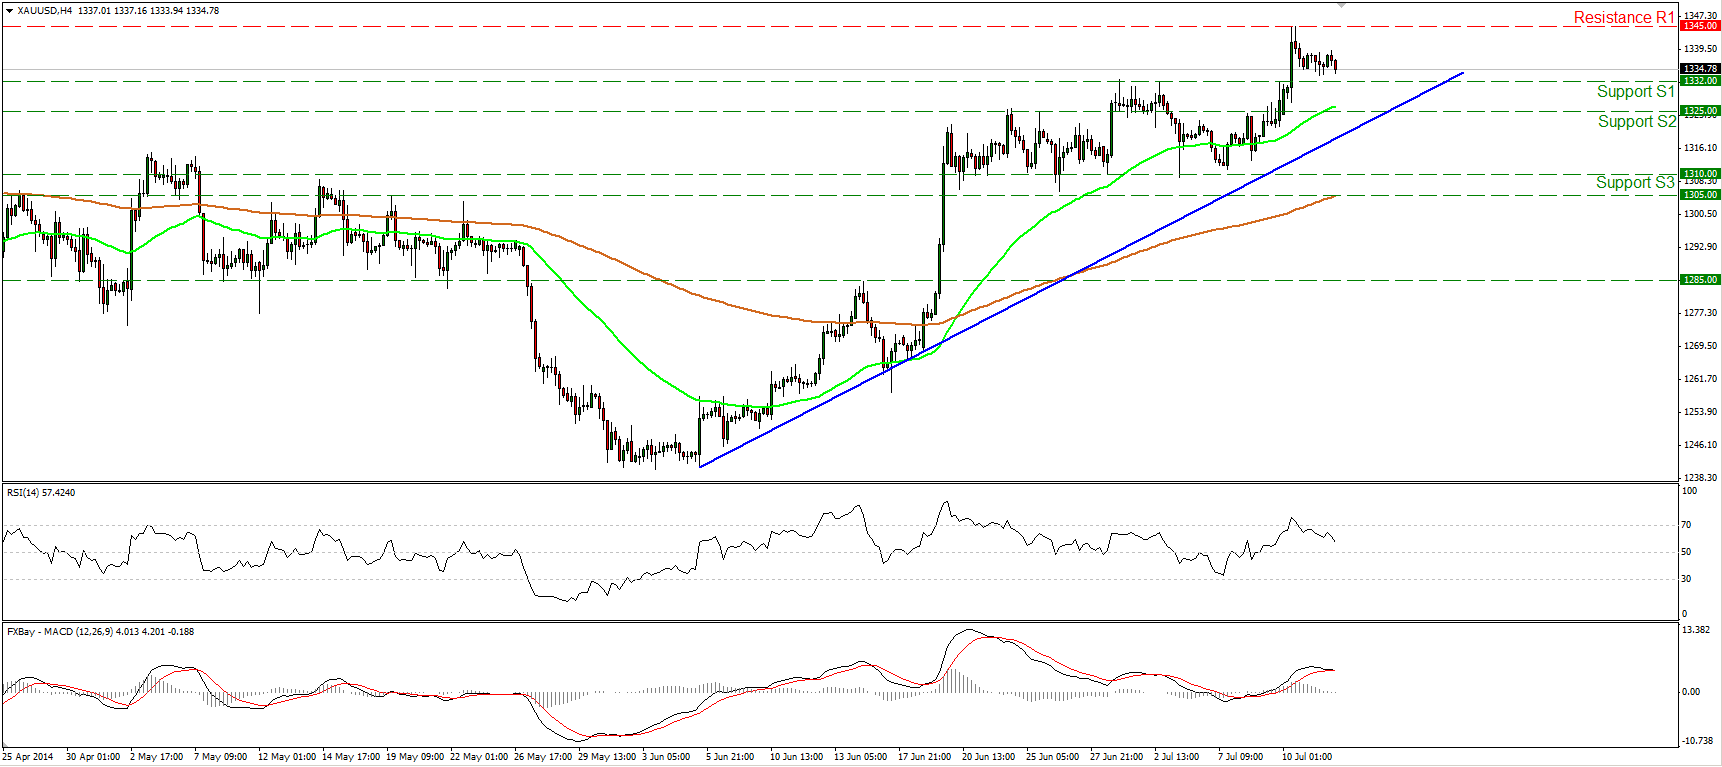
Gold declined somewhat after finding resistance at 1345 (R1). Considering that the RSI moved lower after exiting overbought conditions and that the MACD seems ready to cross below its signal line, I cannot rule out the continuation of the pullback, maybe towards the support area of 1325 (S2). Nevertheless, as long as the precious metal is trading above the blue uptrend line and above both the moving averages, the short-term picture remains to the upside. A decisive break of the 1345 (R1) hurdle could bring trend continuation and is likely to target the next resistance at 1355 (R2). On the daily chart, gold remains above the 200-day moving average, while the 50-day moving average seems ready to cross above the 200-day moving average in the near future. This increases the likelihood for the continuation of the uptrend.
• Support: 1332 (S1), 1325 (S2), 1310 (S3) .
• Resistance: 1345 (R1), 1355 (R2), 1365 (R3).
confirms the negative picture
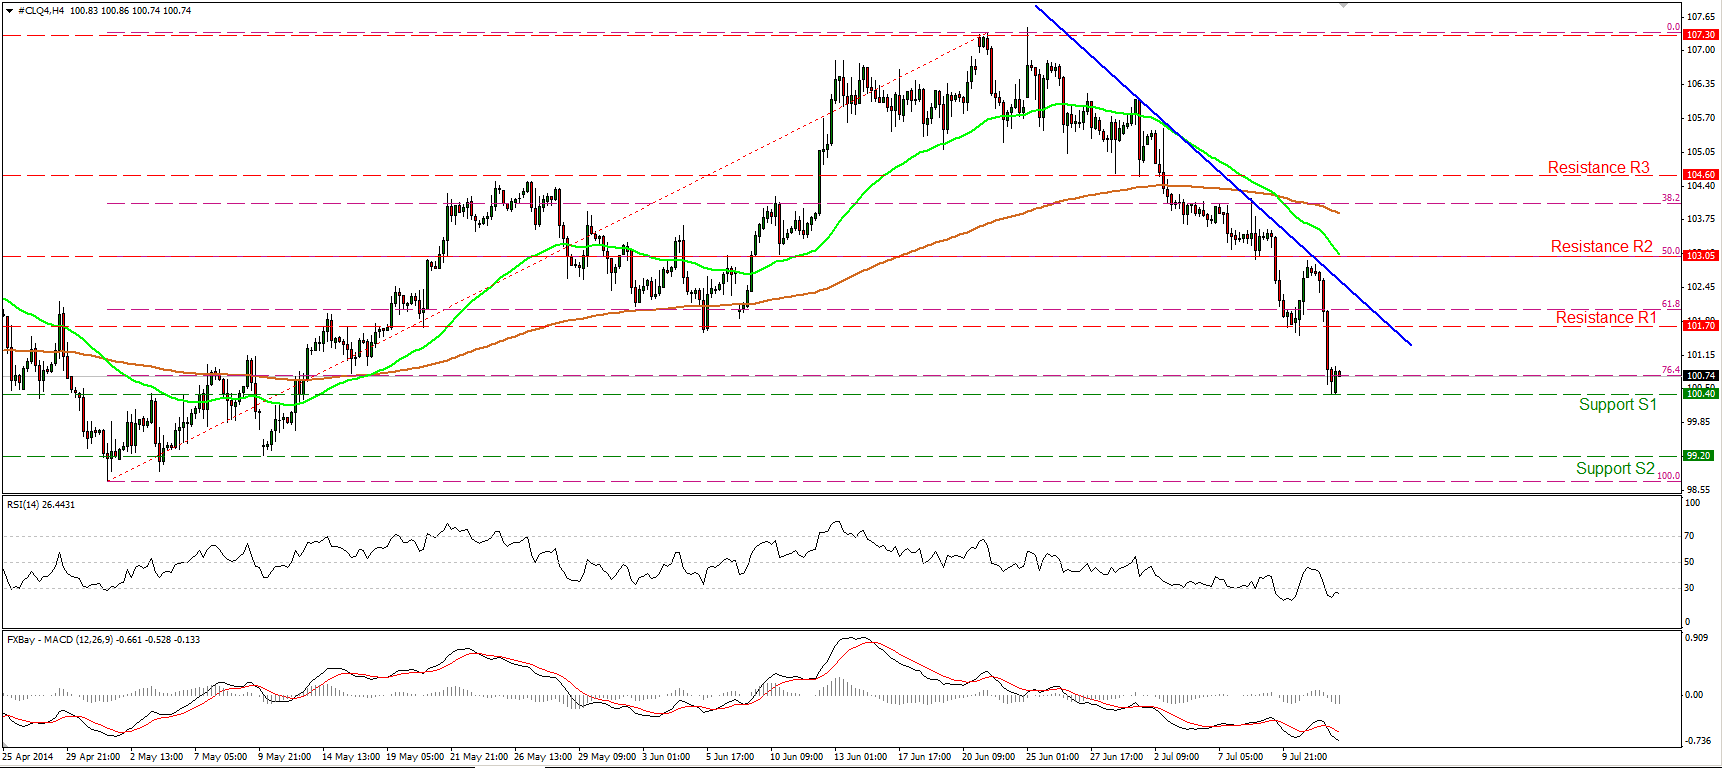
WTI plunged on Friday after finding resistance at 103.05 (R2). The price fell below the 101.70 hurdle to find support at 100.40 (S1), slightly below the 76.4% retracement level of the May 1st – June 23rd advance. Such a move confirms a lower low and having in mind that WTI is trading below both the moving averages and blue downtrend line, I still see a negative picture. A clear move below 100.40 (S1) could carry larger bearish implications and could pave the way towards the next support at 99.20 (S2). However, the RSI lies within its oversold field and seems willing to challenge its 30 level. As a result, further consolidation or a bounce seems possible before the bears prevail again.
• Support: 100.40 (S1), 99.20 (S2), 98.75 (S3).
• Resistance: 101.70 (R1), 103.05 (R2), 104.60 (R3).
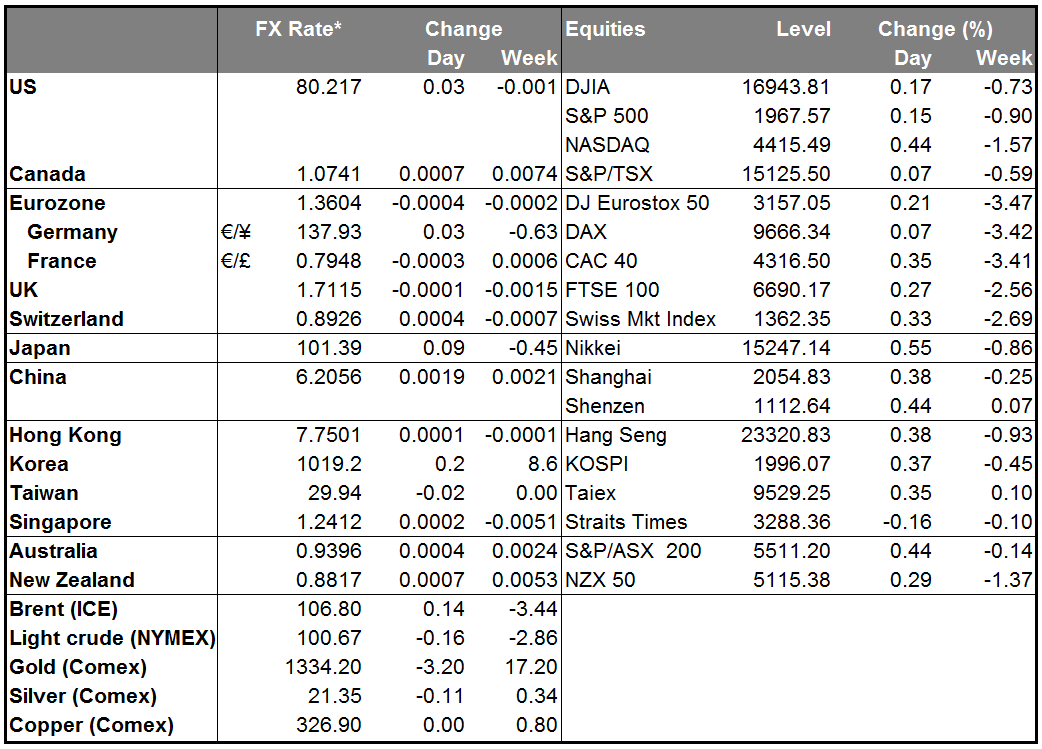
MARKETS SUMMARY

