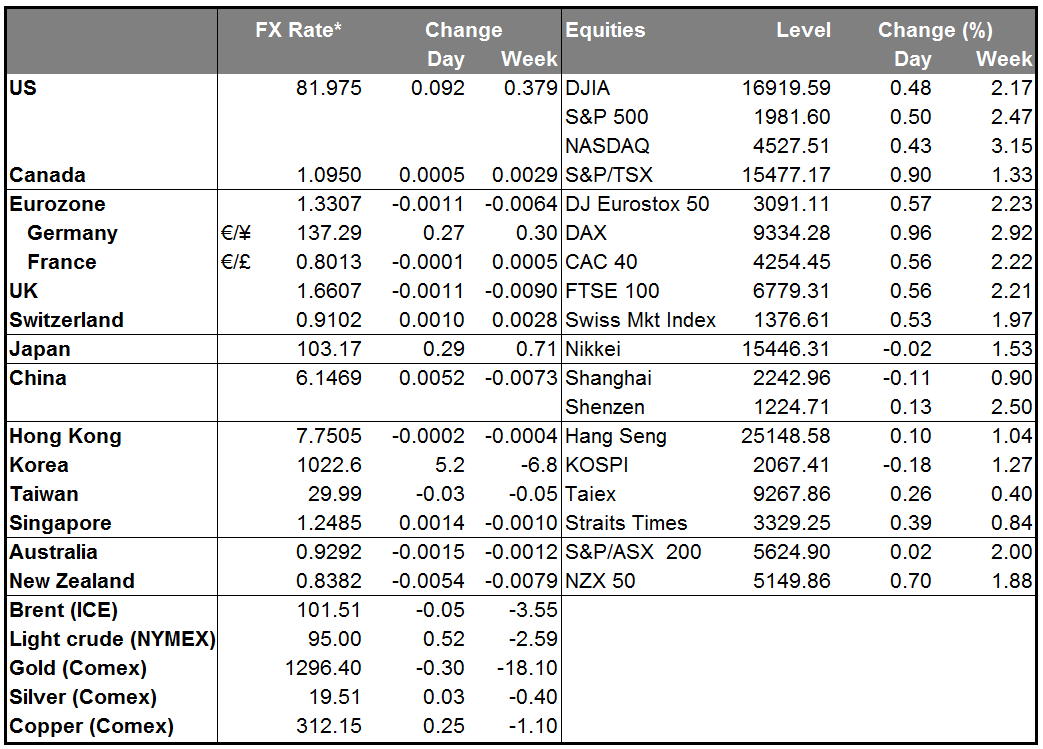
The dollar was up against almost every currency we track over the last 24 hours. Yesterday’s announcement of much stronger-than-expected housing starts and building permits for July, coming after the strong NAHB sentiment index, has given the market more confidence that the Fed is likely to start hiking rates soon. Fed Chair Janet Yellen has cited the weakness in the housing market as one reason for being cautious. For example, in her testimony to Congress last month, she said the housing sector “has shown little recent progress” and that “readings this year have, overall, continued to be disappointing.” If housing is now back on an improving trend, then that removes one more barrier to tightening.
AUD moved lower before Reserve Bank of Australia Governor Glenn Stevens gave his semi-annual testimony before the House of Representatives economics committee. While he mostly reiterated the view expressed in the minutes of the recent RBA meeting about economic growth, he added that the risk of a material fall in the AUD is “underestimated” and said that intervention to stem its rise remains part of the RBA’s “toolkit.” Nonetheless AUD was slightly higher after he spoke than before he started, probably because he downplayed the usefulness of further monetary easing at this point. I still feel AUD is overvalued and is likely to decline.
Japan’s trade deficit in July was largely unchanged from June on a seasonally adjusted basis, but was much worse than expected. Exports did OK, rising largely in line with expectations; the surprise was on imports, which rose instead of falling as expected. The country’s continuing trade deficit is one reason why I believe the yen is likely to weaken further. The figures had little impact when announced, but later, after the EUR/USD broke through the 1.3330 support, the USD/JPY moved sharply higher and took out the July 30th high of 103.09, setting the stage for further gains.
Today’s indicators: During the European day, German PPI for July is coming out and the forecast is for the pace to remain unchanged on a mom and yoy basis.
In the UK, the Bank of England releases the minutes of its August policy meeting. Following BoE Gov. Carney comments last Wednesday that the committee has a “wide range of views” on the level of slack in the economy, the chances that we might see a dissenting vote in the minutes has increased. This view was further supported after BoE chief was quoted in the Sunday Times as saying that the Bank can raise rates even before it sees the “fact” of higher wages. On the other hand, the softening of inflation in July, on top of the recent poor data coming from the country, offset the hawkish tone and disappointed the market pushing GBP down. If there are no dissenting votes, I expect sterling to fall further, given the recent string of poor data for the UK. If the meeting minutes reveal a dovish picture, we could see the pair below 1.6600 for the first time since the 7th of April.
In the US, the FOMC will also publish the minutes from its most recent meeting. The statement following the meeting had no significant changes in policy guidance, but the tone was nonetheless slightly more hawkish, in line with the improvements in the economy. It showed that the Committee believes it is getting closer to achieving its goals with regards to both inflation and employment. Thus the minutes could reinforce this idea of steady progress and give the USD rally another leg up. At the same time, the statement highlighted the difficulty the FOMC has in figuring out what’s really going on with the labor market, as different indicators give different readings. The debate about which indicators truly reflect the labor market is in effect a debate between the hawks and the doves, who each emphasize those indicators that back up their own views. We might get more details on this debate in Wednesday’s minutes, but they are likely to be overshadowed by the discussion of this precise topic at the Jackson Hole symposium during the rest of the week. This debate may temper some of the dollar’s strength, because anything that shows the labor market as still weak could be used to justify keeping rates low for longer than the rapidly falling unemployment rate by itself would imply.
The MBA mortgage applications for the week ended on the 15th of August are also released.
From Canada, we get wholesale trade sales for June.
Norges Bank Governor Oeystein Olsen speaks.
The Market
EUR/USD dips below 1.3330
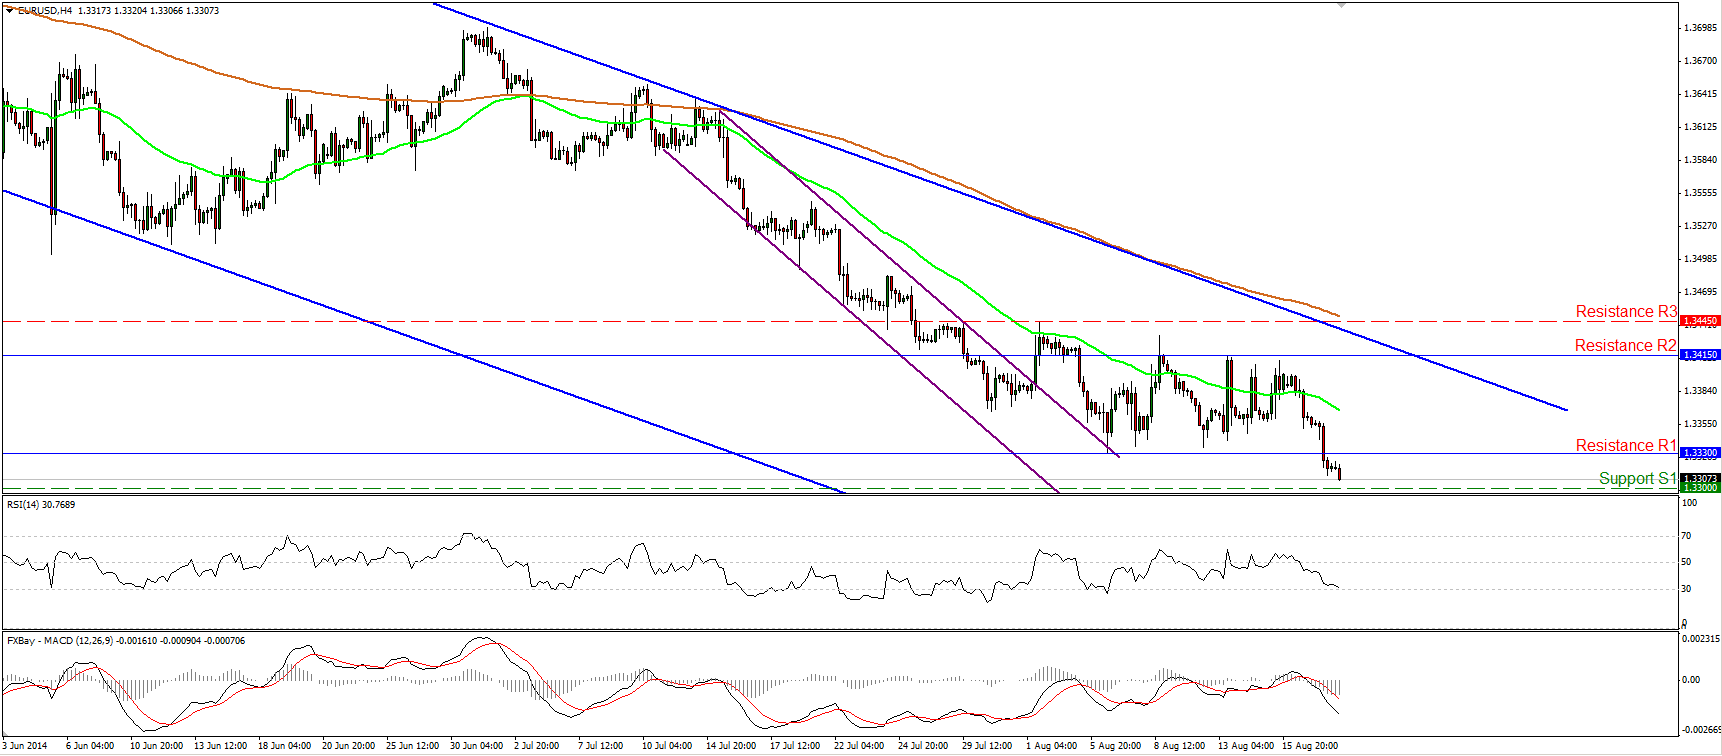
The EUR/USD tumbled on Tuesday after US housing starts and building permits rose more than anticipated in July. The pair fell below 1.3330 (support turned into resistance), the lower boundary of the range it’s been trading since the beginning of August, and is now trading marginally above our support line of 1.3300 (S1), marked by the lows of the 7th of November 2013. Today we have the minutes from the latest FOMC meeting, and if the minutes confirm the somewhat more hawkish tone of the meeting’s statement, we could see the rate closing below 1.3300 (S1) for the first time since last September. Such a break could set the stage for larger bearish extensions, perhaps towards the 1.3200 (S2) zone. As long as the pair is trading within the blue downside channel, connecting the highs and the lows on the daily chart, the overall outlook remains negative, in my view.
• Support: 1.3300 (S1), 1.3200 (S2), 1.3100 (S3).
• Resistance: 1.3330 (R1), 1.3415 (R2), 1.3445 (R3).
GBP/USD collapses after UK CPI data
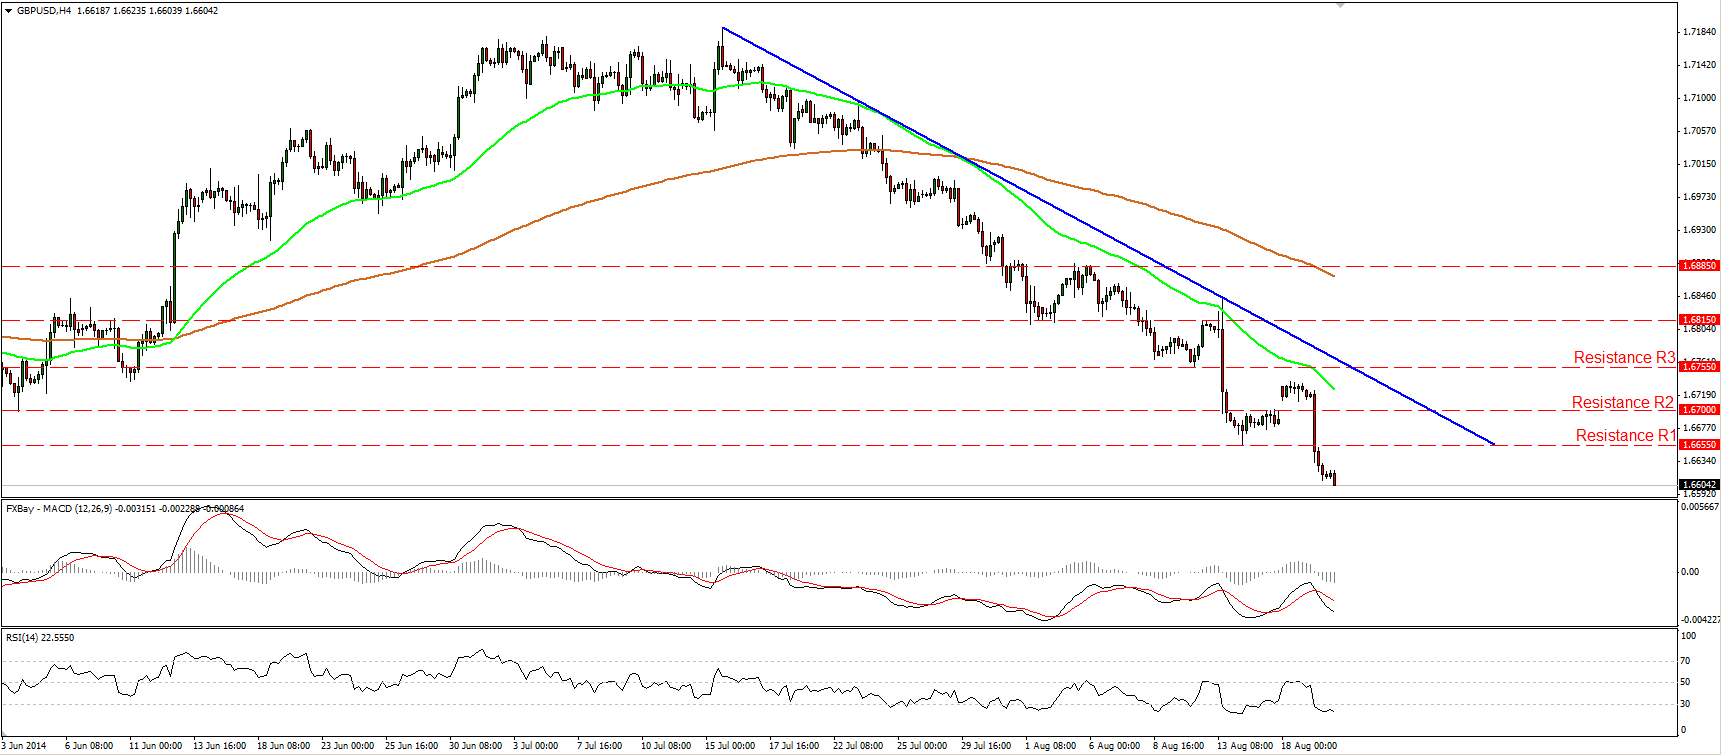
GBP/USD fell sharply yesterday after the UK CPI slowed by more than anticipated in July. Cable moved back below 1.6700 and managed to overcome last week’s low of 1.6655. If the minutes of the August BoE meeting, published today, reveal a dovish tone and if we don’t see at least one dissenting vote, I would expect the decline to continue and target the lows of the 4th of April at 1.6550 (S1). As long as the rate is printing lower highs and lower lows below the blue downtrend line and below both the moving averages I would consider the near-term bias to be negative. On the daily chart, the rate remains below the 80-day exponential moving average, which provided support to the lows of the price action during the prevailing uptrend, amplifying the case for further declines in the future.
• Support: 1.6550 (S1), 1.6460 (S2), 1.6350 (S3).
• Resistance: 1.6655 (R1), 1.6700 (R2), 1.6755 (R3).
EUR/JPY rebounds from near 136.75
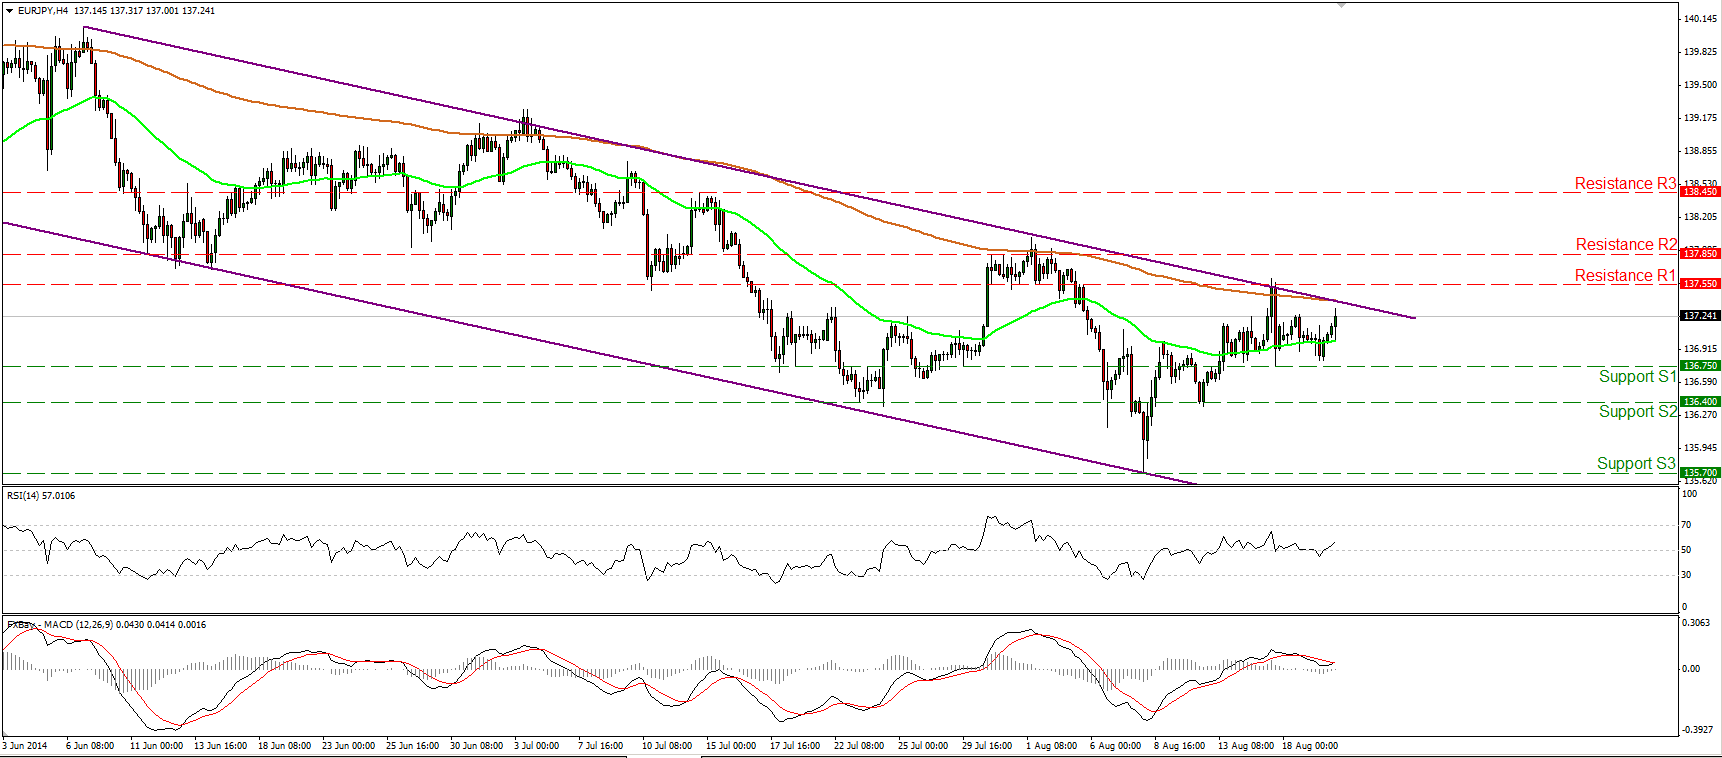
EUR/JPY found support slightly above our support bar of 136.75 (S1) and rebounded to trade marginally below the upper boundary of the purple downside channel. Although the rate remains within the channel and technically this keeps the downside path intact, I would take the sidelines for now. After testing the channel’s upper bound on Friday, the rate failed to decline significantly and found support at 136.75 (S1). As a result I cannot rule out a move out of the channel this time. On the daily chart, the rate remains below both the 50- and the 200-day moving averages, while the 14-day RSI seems willing to move above its 50 line and the daily MACD already above its trigger, is heading towards its zero line. All these mixed technical factors give me enough reasons to stay neutral at the moment.
• Support: 136.75 (S1), 136.40 (S2), 135.70 (S3).
• Resistance: 137.55 (R1), 137.85 (R2), 138.45 (R3).
Gold struggles near 1295
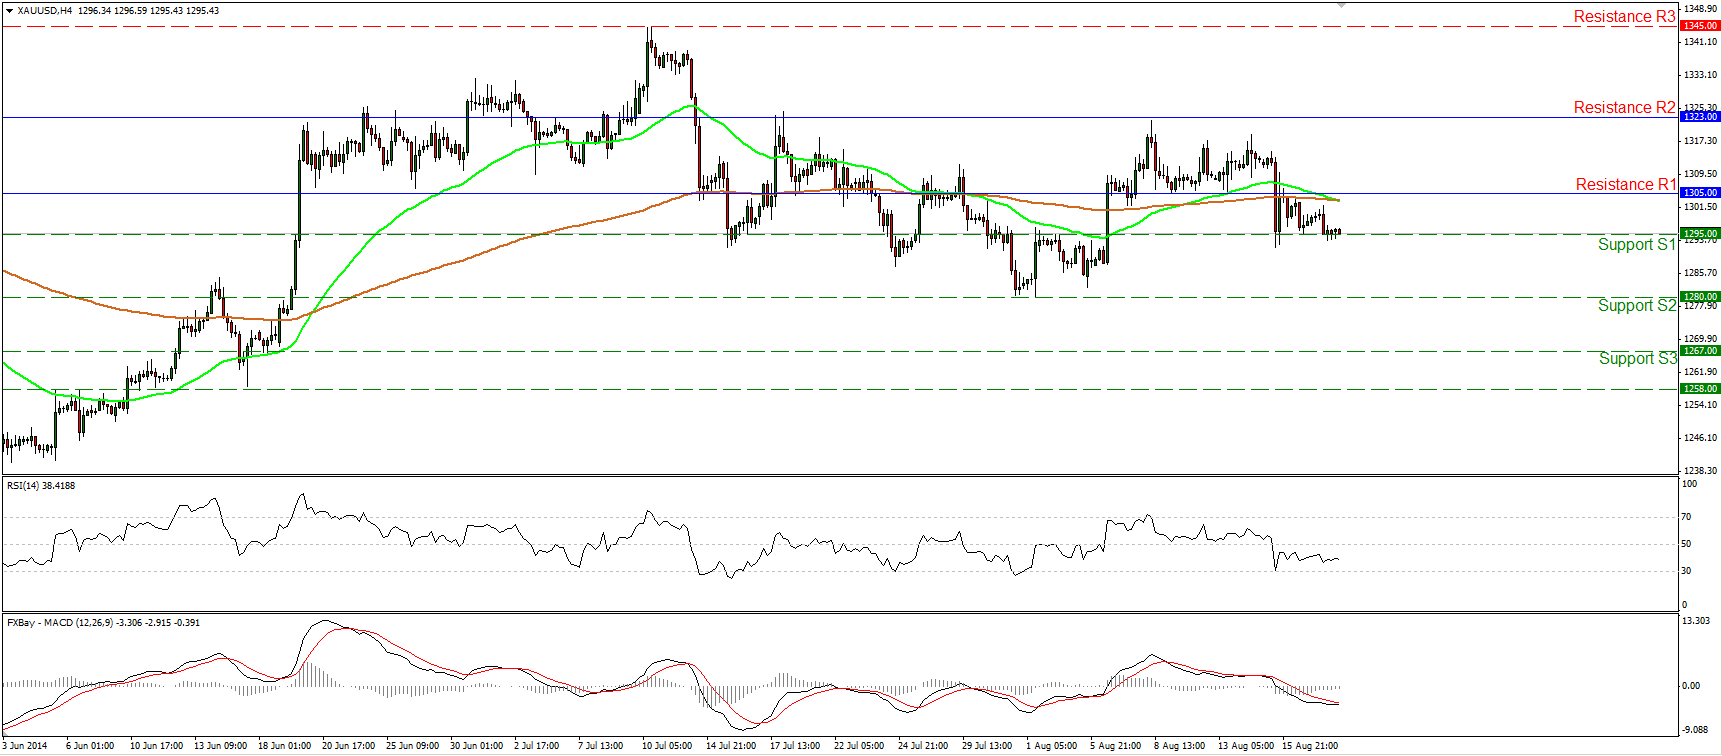
Gold moved somewhat lower to touch again and sit on the support line of 1295 (S1). At the time of writing, the precious metal is testing that obstacle and if the bears are strong enough to overcome it, I would expect them to target the next support level, at 1280 (S2). As long as the price remains below 1305 (R1), the lower bound of its prior sideways path, I would consider the near-term outlook cautiously to the downside. However, on the longer-term time frames, I still see a trendless picture and this is confirmed by the fact that both the 50- and 200-day moving averages are still pointing sideways, while both our weekly momentum studies lie on their neutral lines.
• Support: 1295 (S1), 1280 (S2), 1267 (S3).
• Resistance: 1305 (R1), 1323 (R2), 1345 (R3).
WTI reinforces the downtrend
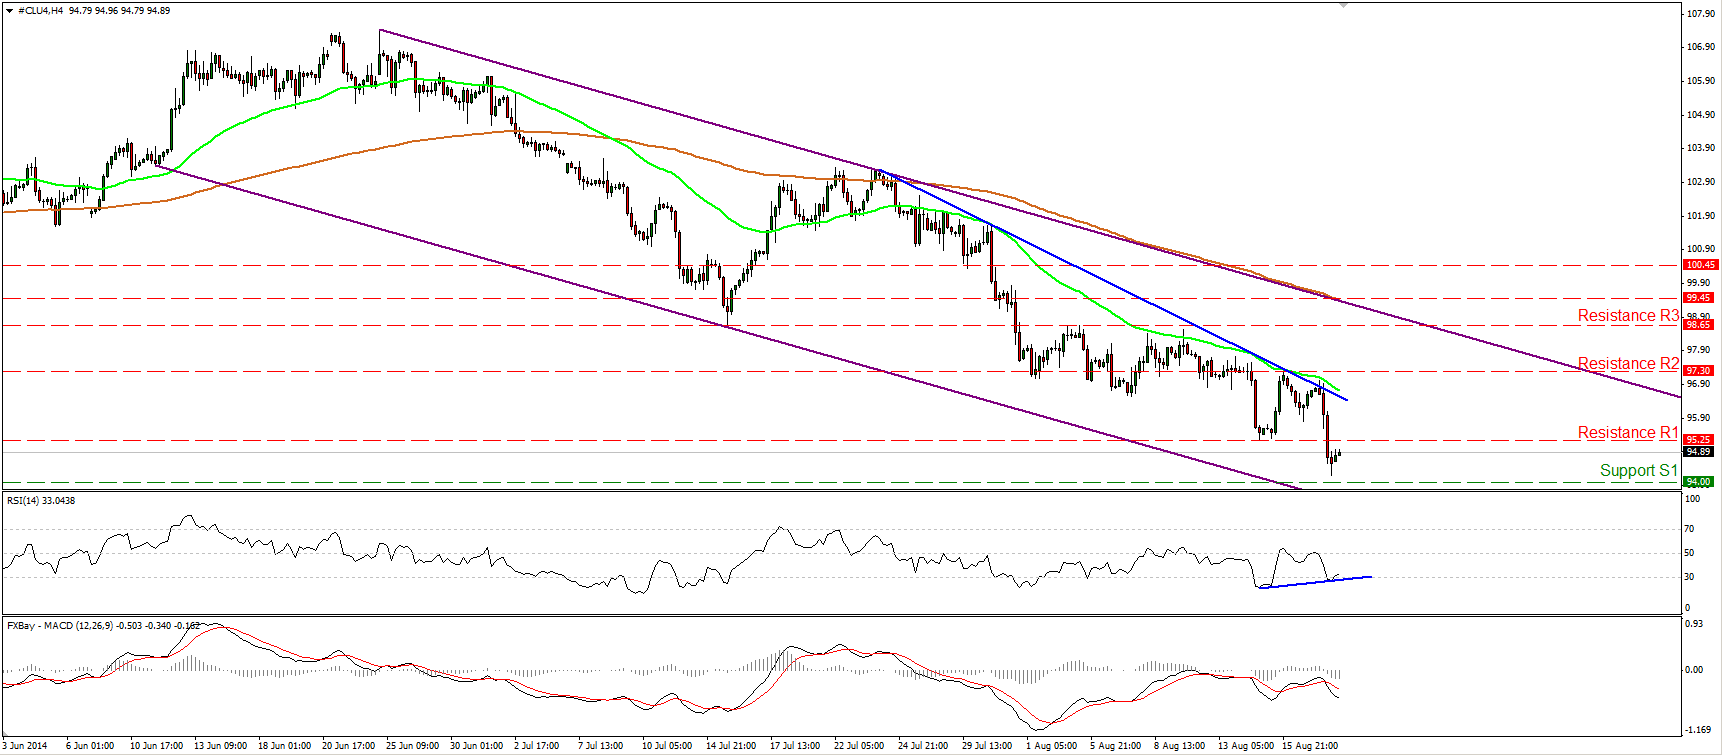
WTI fell sharply yesterday after finding resistance at the near-term blue downtrend line. The price dipped below last week’s lows of 95.25 (support turned into resistance), but the decline was halted slightly above our support level of 94.00 (S1). A clear dip below that hurdle is likely to trigger extensions towards the 93.00 (S2) zone. However, although I see a negative overall picture, taking into account our proximity to the lower boundary of the purple downside channel and the positive divergence between the RSI and the price action, I cannot rule out an upside corrective move before sellers take control again.
• Support: 94.00 (S1), 93.00 (S2), 91.70 (S3).
• Resistance: 95.25 (R1), 97.30 (R2), 98.65 (R3).

