Trading was slow on Monday with a poor Pending Home Sales and little other fundamental news of any significance, which makes the day’s dollar rally slightly unexpected. Some market commentators have hypothesised that there were fundamental factors from Iran at play causing risk off behaviour, but it seems more likely that this was a technical play on thin volumes, since numerous pairs met support or resistance simultaneously, allowing for an exaggeration of the pull-back. Thanksgiving and month end flows may have also contributed to the market’s reluctance to hold position.
Tuesday sees CB Consumer Confidence and delayed Building Permits from the US and an Inflation Report Hearings from the BOE, which will hopefully coax some liquidity back into the markets, although the week looks set to be quiet and messy given Monday’s price action.
USD% Index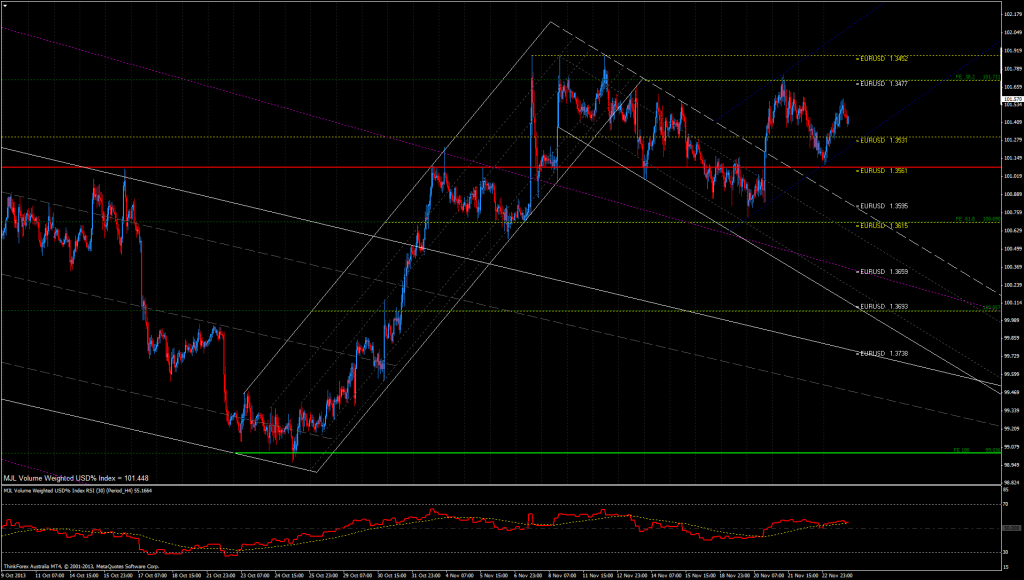
After the drop back to support, the dollar found it’s feet in early trading and continued to push higher throughout the day, with few willing to step in with fresh dollar shorts. As such we have posted a higher low so the market’s willingness to post a higher high next will be keenly watched for directional clues. It is entirely possible that a double top may happen before a drop lower for the end of the year and a potential Santa Claus rally in risk currencies to push the dollar back down again, so this may just be pre-December positioning. RSI is just about above the 100 day moving average which is weak bullish signal.
I remain bearish USD
USD% Index Resistance (EUR/USD support): EUR/USD 1.3477, 1.3450
USD% Index Support (EUR/USD support): EUR/USD 1.3531, 1.3561, 1.3600
EUR% Index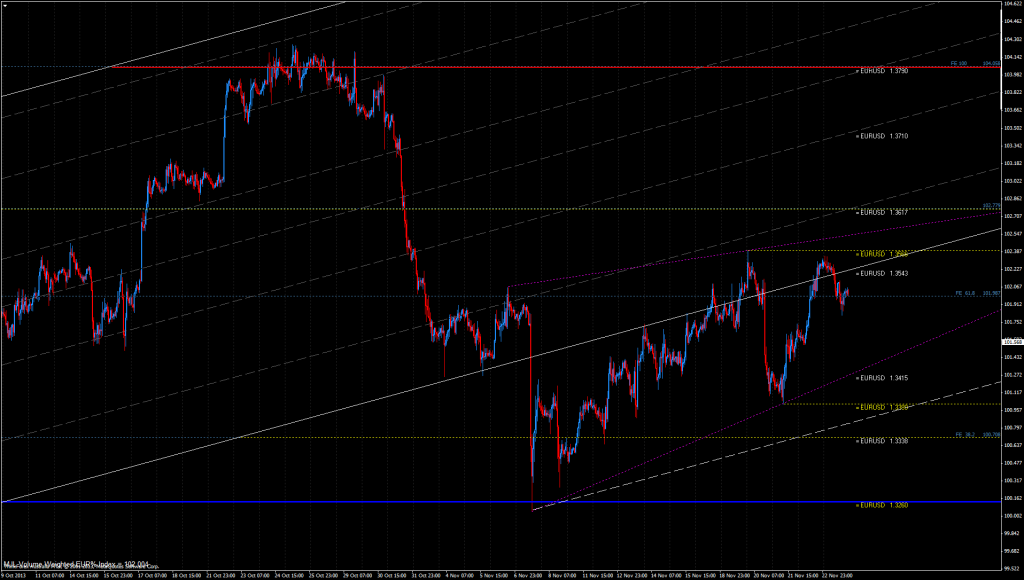
The EUR% index’s double top is proving tricky to defeat with Monday’s attempt higher sold off with more vigour than expected. Trend remains bullish so this may just be a waiting game, although it’s not comforting that the dollar rallied on moderately poor US data. We are definitely in a cautious wait and see mode for the time being although our bias remains bullish EUR
EUR% Index Resistance: EUR/USD 1.3543, 1.3565, 1.3600, 1.3617
EUR% Index Support: EUR/USD 1.3500, 1.3450, 1.3415, 1.3400
JPY% Index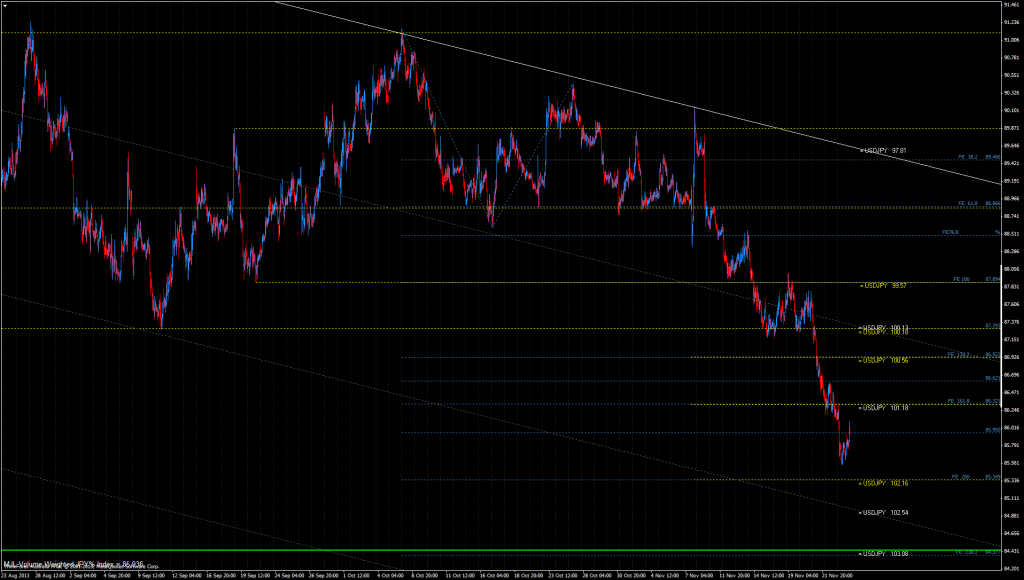
The JPY% index also found it’s feet today with a mild show of strength although not from a technically significant level or due to any major fundamental news. The strength of the Dollar and Yen make Monday appear like a risk-off day, pushing the Yen up, although this wasn’t reflected in stocks and there really wasn’t a significant catalyst to trigger the moves so we will need to see how things develop for the time being. The rate of decent recently for the Yen could have contributed to the keenness to take profit but it seems odd that we didn’t test the 200% Fib expansion first. I remain bearish JPY
JPY% Index Resistance (USD/JPY Support): USD/JPY 101.18, 101.00, 100.56
JPY% Index Support (USD/JPY Resistance): USD/JPY 102.16, 103.00
GBP% Index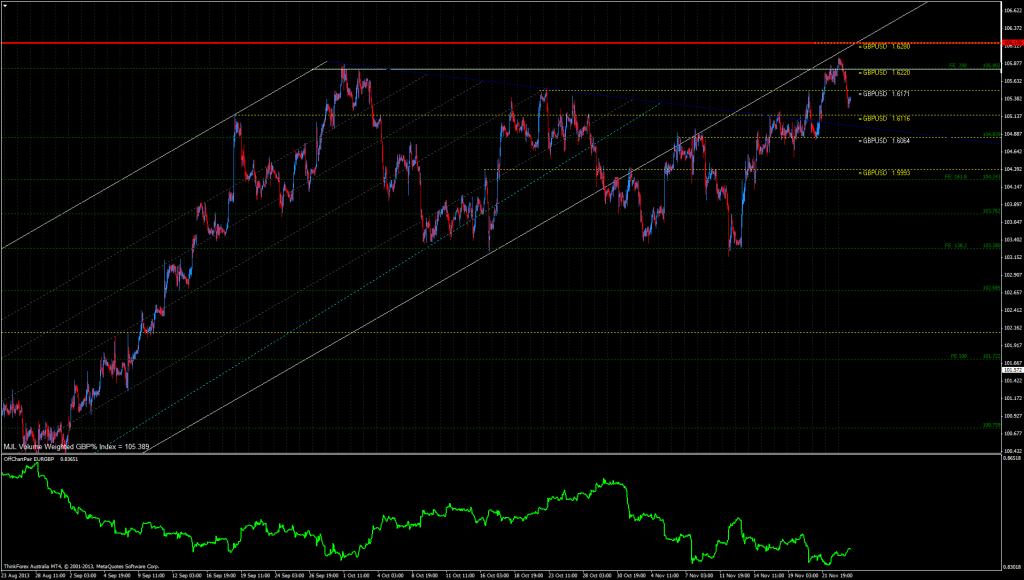
The GBP% index broke above the recent highs on Monday although the move was quickly faded. Interestingly the break of GBP% index highs was not negatively correlated with a break of EURGBP lows, instead the Euro advanced against the pound and took the wind out of it’s sales somewhat. Either way the GBP% index has retraced back below major resistance having not tested the long standing resistance shown at GBPUDSD 1,6280. We should still see a test of this big number which will be the big decider for medium term direction. I remain bullish GBP
GBP% Index Resistance: GBP/USD 1.6171, 1.6220, 1.6280
GBP% Index Support: GBP/USD 1.6116, 1.6064, 1.6000
AUD% Index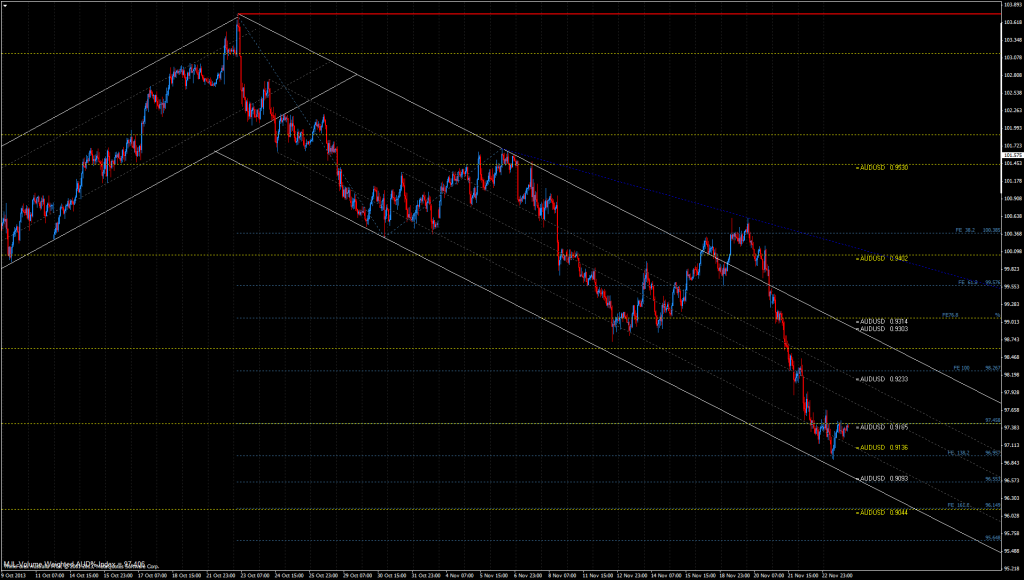
A long continuous drop in the AUD% index has almost retested the bottom of the bearish channel, which could see a slight bounce now that the index has become oversold. However the overall theme will likely remain bearish within this defined range following the expectations of a rate cut or other further stimulus from the RBA. RSI is now reading quite oversold on AUD/USD and overbought on EURAUD so we could see a slight consolidation of the recent moves before continuation. I am bearish AUD although we may see a slight bounce
AUD% Index Resistance: AUD/USD 0.9165, 0.9233, 0.9300
AUD% Index Support: AUD/USD 0.9136, 0.9093
CHF% Index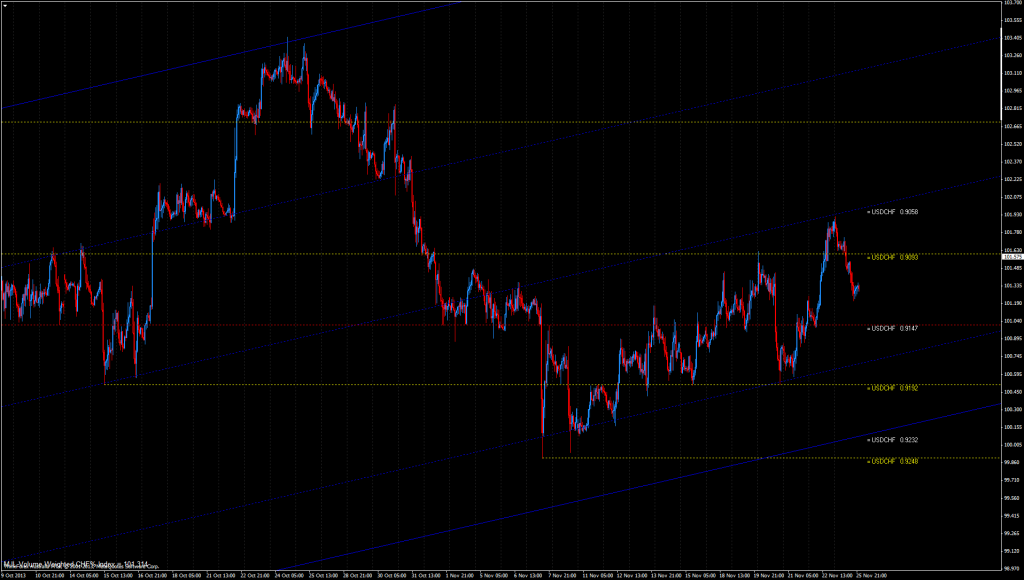
The Swiss Franc sold off from resistance all day on Monday although trend remains bullish. The sell-of is still within acceptable tolerances for a continuation higher, and given the 170pip drop in EUR/USD recently we may expect some bumpy trends and cautious trading for the time being. I am bullish CHF
CHF% Index Resistance (USD/CHF support): USD/CHF 0.9093, 0.9058
CHF% Index Support (USD/CHF resistance): USD/CHF 0.9150, 1.92000, 0.9238
- English (UK)
- English (India)
- English (Canada)
- English (Australia)
- English (South Africa)
- English (Philippines)
- English (Nigeria)
- Deutsch
- Español (España)
- Español (México)
- Français
- Italiano
- Nederlands
- Português (Portugal)
- Polski
- Português (Brasil)
- Русский
- Türkçe
- العربية
- Ελληνικά
- Svenska
- Suomi
- עברית
- 日本語
- 한국어
- 简体中文
- 繁體中文
- Bahasa Indonesia
- Bahasa Melayu
- ไทย
- Tiếng Việt
- हिंदी
Dollar Rallies On Thin Trading Volume
Published 11/26/2013, 04:02 AM
Updated 07/09/2023, 06:31 AM
Dollar Rallies On Thin Trading Volume
3rd party Ad. Not an offer or recommendation by Investing.com. See disclosure here or
remove ads
.
Latest comments
Install Our App
Risk Disclosure: Trading in financial instruments and/or cryptocurrencies involves high risks including the risk of losing some, or all, of your investment amount, and may not be suitable for all investors. Prices of cryptocurrencies are extremely volatile and may be affected by external factors such as financial, regulatory or political events. Trading on margin increases the financial risks.
Before deciding to trade in financial instrument or cryptocurrencies you should be fully informed of the risks and costs associated with trading the financial markets, carefully consider your investment objectives, level of experience, and risk appetite, and seek professional advice where needed.
Fusion Media would like to remind you that the data contained in this website is not necessarily real-time nor accurate. The data and prices on the website are not necessarily provided by any market or exchange, but may be provided by market makers, and so prices may not be accurate and may differ from the actual price at any given market, meaning prices are indicative and not appropriate for trading purposes. Fusion Media and any provider of the data contained in this website will not accept liability for any loss or damage as a result of your trading, or your reliance on the information contained within this website.
It is prohibited to use, store, reproduce, display, modify, transmit or distribute the data contained in this website without the explicit prior written permission of Fusion Media and/or the data provider. All intellectual property rights are reserved by the providers and/or the exchange providing the data contained in this website.
Fusion Media may be compensated by the advertisers that appear on the website, based on your interaction with the advertisements or advertisers.
© 2007-2024 - Fusion Media Limited. All Rights Reserved.
