Get 40% Off
🚨 Volatile Markets? Find Hidden Gems for Serious Outperformance
Find Stocks Now

Dollar Jumps To 101.00 As Yellen Signals Rate Increase

Published 11/18/2016, 04:43 AM
Updated 08/29/2019, 07:20 AM

The US dollar was seen trading above 101.00 in early Asian trading today spurred by positive comments on the economy by Fed Chair Janet Yellen. Testifying to the Joint Economic Committee at Washington yesterday, Yellen signaled that rate hikes were coming soon. US stocks closed higher after her comments while the dollar is set to close the second week with strong gains.

Positive US economic data also helped to fuel the dollar's rally as October's inflation figures rose 1.6% on the year marking the fastest increase in inflation, while housing starts jumped 25.5% on the year to a seasonally adjusted rate of 1.32 million units. The initial jobless claims fell 19k to 235k for the week ending November 12, marking the lowest in 40-years.

USD/JPY Intra-day Analysis
USD/JPY 4 Hour Chart

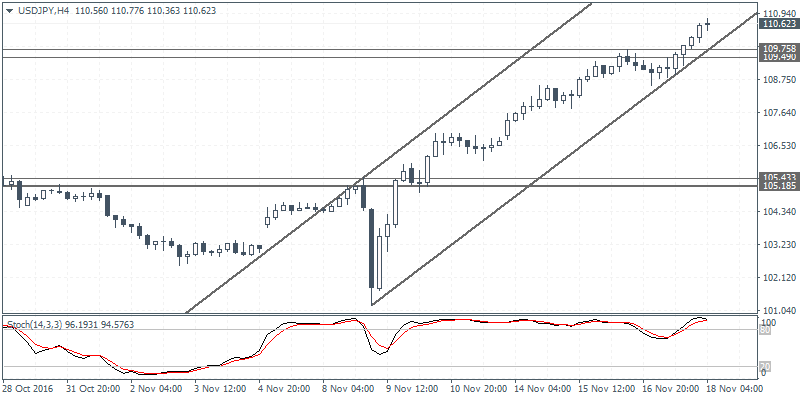
USD/JPY (101.62) rose 0.98% yesterday as the dollar comfortably broke above the 110 yen handle. The bullish continuation following the doji candlestick pattern formed just two days ago signals further continuation to the upside unless we see a bearish close today. Minor support can be seen forming near 109.75 - 109.49 region which could keep the bullish momentum going, while a break below this level could signal an impending correction down to 105.43 - 105.18 support.

NZD/USD Daily Analysis
NZD/USD Daily Chart

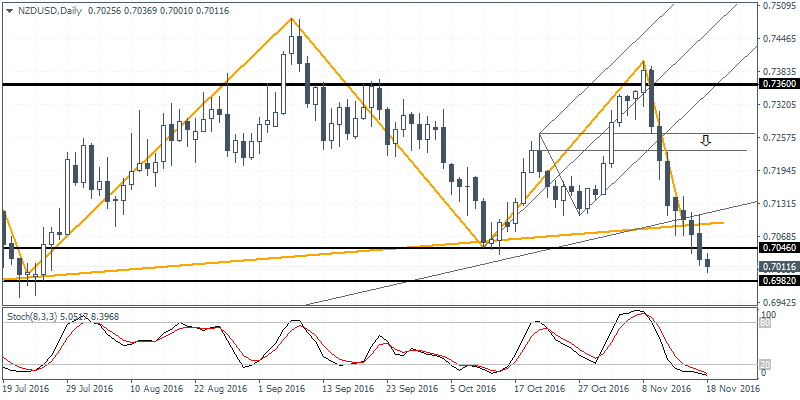
NZD/USD (0.7011) continues to extend its declines with prices seen entering the support level of 0.7046 - 0.6982. Continued declines could see the kiwi closing bearish for a second week following the bearish engulfing pattern previously. The downside target for NZD/USD remains at 0.6800 initially followed by a decline to 0.6659. In the near term, kiwi could be seen consolidating at the current support levels, but the upside could be limited to 0.7050.

3rd party Ad. Not an offer or recommendation by Investing.com. See disclosure here or remove ads .

Crude Oil Intra-day Analysis

Crude Oil 4 Hour Chart

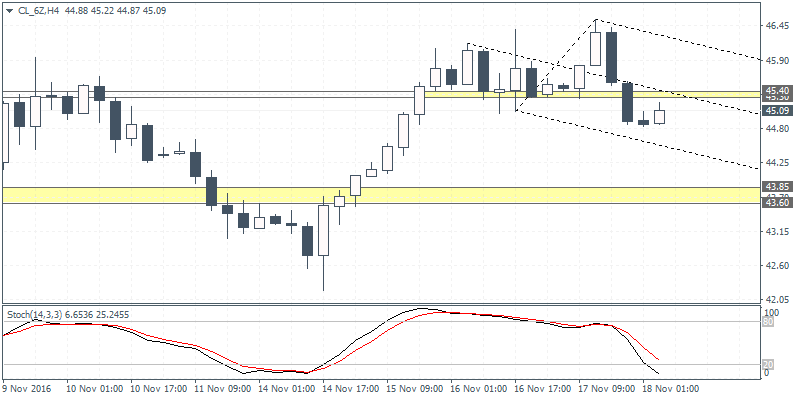
CLZ6 (45.09) Crude oil prices closed bearish for the second day after rising to a four-day high of $43.55 earlier this week. The failure to clear above this daily close saw oil futures posting moderate declines. Technical resistance is seen at the $45.40 - $45.30 region which could be tested in the near term. Failure to clear this resistance could see oil futures slip towards the lower support at $43.85 - $43.60 levels.

Latest comments

Risk Disclosure: Trading in financial instruments and/or cryptocurrencies involves high risks including the risk of losing some, or all, of your investment amount, and may not be suitable for all investors. Prices of cryptocurrencies are extremely volatile and may be affected by external factors such as financial, regulatory or political events. Trading on margin increases the financial risks.
Before deciding to trade in financial instrument or cryptocurrencies you should be fully informed of the risks and costs associated with trading the financial markets, carefully consider your investment objectives, level of experience, and risk appetite, and seek professional advice where needed.
Fusion Media would like to remind you that the data contained in this website is not necessarily real-time nor accurate. The data and prices on the website are not necessarily provided by any market or exchange, but may be provided by market makers, and so prices may not be accurate and may differ from the actual price at any given market, meaning prices are indicative and not appropriate for trading purposes. Fusion Media and any provider of the data contained in this website will not accept liability for any loss or damage as a result of your trading, or your reliance on the information contained within this website.
It is prohibited to use, store, reproduce, display, modify, transmit or distribute the data contained in this website without the explicit prior written permission of Fusion Media and/or the data provider. All intellectual property rights are reserved by the providers and/or the exchange providing the data contained in this website.
Fusion Media may be compensated by the advertisers that appear on the website, based on your interaction with the advertisements or advertisers.
© 2007-2024 - Fusion Media Limited. All Rights Reserved.