Over several decades, I have produced content for radio, television, magazines and web sites. And one of my longest-standing themes has been the silliness surrounding what constitutes a “bargain” in a stock market.
Advocates for employing price-to-earnings ratios (P/Es) debate whether to use trailing 12 months or forward 12 months or trailing 10 years; some even adjust the target based on comparable bond yields, historical averages and inflation, while others decide “appropriate” P/Es based on a particular sector. Still others believe P/Es are entirely over-rated, and prefer to use price-to-sales ratios or price-to-book in making their “call.” Meanwhile, some may rely more on price alone such that, if the S&P 500 were 15% below a high, that would represent a 15% discount.
Simply put, if gurus cannot agree on what determines a decent value, how can investors be any more proficient at selecting sure-fire winners for the so-called long haul? They cannot…or we might all be tripping over ourselves to buy Apple (AAPL) at $425.
In spite of widespread inconsistencies and inanities, I admit to a fondness for historical data. And I recently came across an article that presented a country-by-country breakdown for current and median 10-year price-to-earnings ratios (a.k.a. CAPE or cyclically adjusted P/Es). The authors provided evidence that the best investment returns in U.S. stocks occurred when buying and holding U.S. stocks for a decade at the start of a calendar year when the average cyclically adjusted P/E was 30% below the median.
Now, as much as the value-seekers believe that there is a holy grail in finding good things to buy-n-hold, I recognize that the mathematics of compounding require unemotional methods for risk reduction. Collapses, crashes and market catastrophes tend not to discriminate. Indeed, for all the attention placed on the S&P 500 approaching its highs of 2007, investors who minimized exposure to the 2007-2009 disaster were more likely to recover in 1-1 1/2 years… rather than 5 1/2 years.
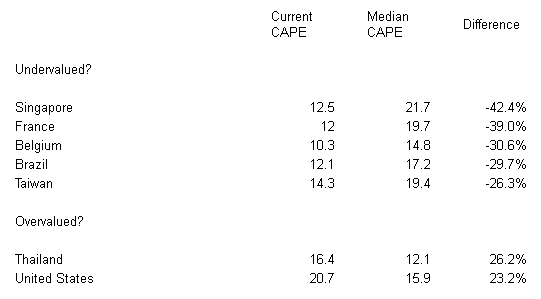
Nevertheless, it may be reasonable to assume one is taking a calculated risk when he/she invests in a country that is currently 25%-30% below its median cyclically adjusted P/E. Here, then, are 5 countries with roughly 25 years of data (or more) that meet this valuation criteria… and a few prominent countries that might be considered “overvalued.”
Country 10-Year P/Es: Recent And Median 
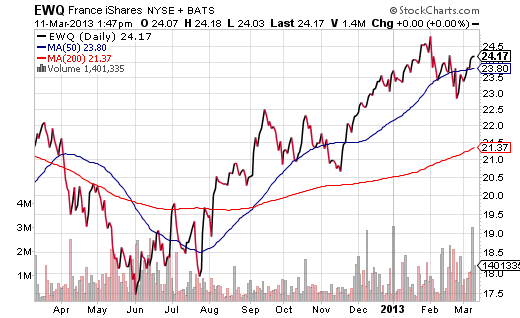
Naturally, it is easy to identify the reasons why certain countries reside where they do. Virtually every country in the euro-zone has a current CAPE that is lower than its median. However, France and Belgium have more years of meaningful data. It is simply not clear to investors whether the euro-zone can survive with dissimilar countries struggling to find a pathway out from underneath the weight of an endless sovereign debt crisis. According to the historical research on global value, however, a buy-n-holder might choose to give iShares MSCI France (EWQ) or iShares MSCI Belgium (EWK) a shot.
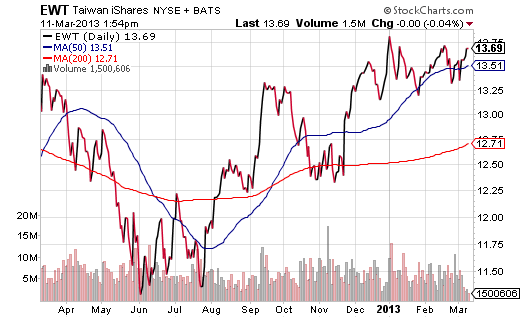
Brazil and Taiwan might be considered bargains from the ranks of the so-called emerging market countries. While China’s high profile slowdown may have hindered these exporting nations from realizing better results in their securities markets, China’s improving economic prospects may help place Brazil and Taiwan on a more prosperous path. Investors who see value in the global valuation approach might like iShares MSCI Taiwan (EWT) and/or iShares MSCI Brazil (EWZ).
Personally, I have more confidence in China’s policies than those of a fractured euro-zone. It follows that I am more likely to select an Asian tiger asset like EWT or a materials mega-cap like EWZ… long before I could see myself investing in an unhedged European country ETF. On the other hand, no matter what exchange-traded vehicle I purchase, I would not blindly hold the investment for a decade based on valuation metrics. I always have a plan to sell and/or hedge.
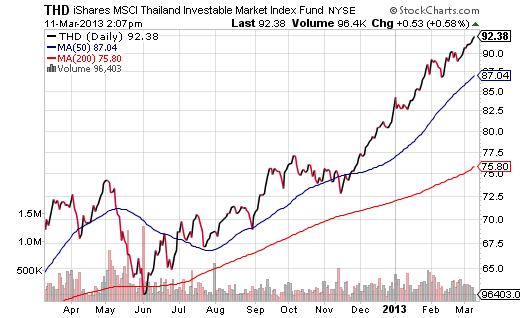
It is important to talk about several countries that came up as severely overvalued. Both the United States as well as Thailand did not fare particularly well with this global valuation methodology. Although I do not view Shiller’s 10-year cyclically adjusted P/E (CAPE) as a definitive valuation method (or any valuation approach as a definitive method), it is still another weapon in the bear’s arsenal. Indeed, iShares MSCI Thailand (THD) has practically levitated 50% from its summertime lows, sits 22% above its long-term 200-day trendline and is likely to hit a profit-taking patch.
Disclosure: Gary Gordon, MS, CFP is the president of Pacific Park Financial, Inc., a Registered Investment Adviser with the SEC. Gary Gordon, Pacific Park Financial, Inc, and/or its clients may hold positions in the ETFs, mutual funds, and/or any investment asset mentioned above. The commentary does not constitute individualized investment advice. The opinions offered herein are not personalized recommendations to buy, sell or hold securities. At times, issuers of exchange-traded products compensate Pacific Park Financial, Inc. or its subsidiaries for advertising at the ETF Expert web site. ETF Expert content is created independently of any advertising relationships.
- English (UK)
- English (India)
- English (Canada)
- English (Australia)
- English (South Africa)
- English (Philippines)
- English (Nigeria)
- Deutsch
- Español (España)
- Español (México)
- Français
- Italiano
- Nederlands
- Português (Portugal)
- Polski
- Português (Brasil)
- Русский
- Türkçe
- العربية
- Ελληνικά
- Svenska
- Suomi
- עברית
- 日本語
- 한국어
- 简体中文
- 繁體中文
- Bahasa Indonesia
- Bahasa Melayu
- ไทย
- Tiếng Việt
- हिंदी
Do These Country ETFs Provide Better Value Than U.S. Stock ETFs?
Published 03/12/2013, 03:18 AM
Updated 03/09/2019, 08:30 AM
Do These Country ETFs Provide Better Value Than U.S. Stock ETFs?
3rd party Ad. Not an offer or recommendation by Investing.com. See disclosure here or
remove ads
.
Latest comments
Install Our App
Risk Disclosure: Trading in financial instruments and/or cryptocurrencies involves high risks including the risk of losing some, or all, of your investment amount, and may not be suitable for all investors. Prices of cryptocurrencies are extremely volatile and may be affected by external factors such as financial, regulatory or political events. Trading on margin increases the financial risks.
Before deciding to trade in financial instrument or cryptocurrencies you should be fully informed of the risks and costs associated with trading the financial markets, carefully consider your investment objectives, level of experience, and risk appetite, and seek professional advice where needed.
Fusion Media would like to remind you that the data contained in this website is not necessarily real-time nor accurate. The data and prices on the website are not necessarily provided by any market or exchange, but may be provided by market makers, and so prices may not be accurate and may differ from the actual price at any given market, meaning prices are indicative and not appropriate for trading purposes. Fusion Media and any provider of the data contained in this website will not accept liability for any loss or damage as a result of your trading, or your reliance on the information contained within this website.
It is prohibited to use, store, reproduce, display, modify, transmit or distribute the data contained in this website without the explicit prior written permission of Fusion Media and/or the data provider. All intellectual property rights are reserved by the providers and/or the exchange providing the data contained in this website.
Fusion Media may be compensated by the advertisers that appear on the website, based on your interaction with the advertisements or advertisers.
© 2007-2024 - Fusion Media Limited. All Rights Reserved.
