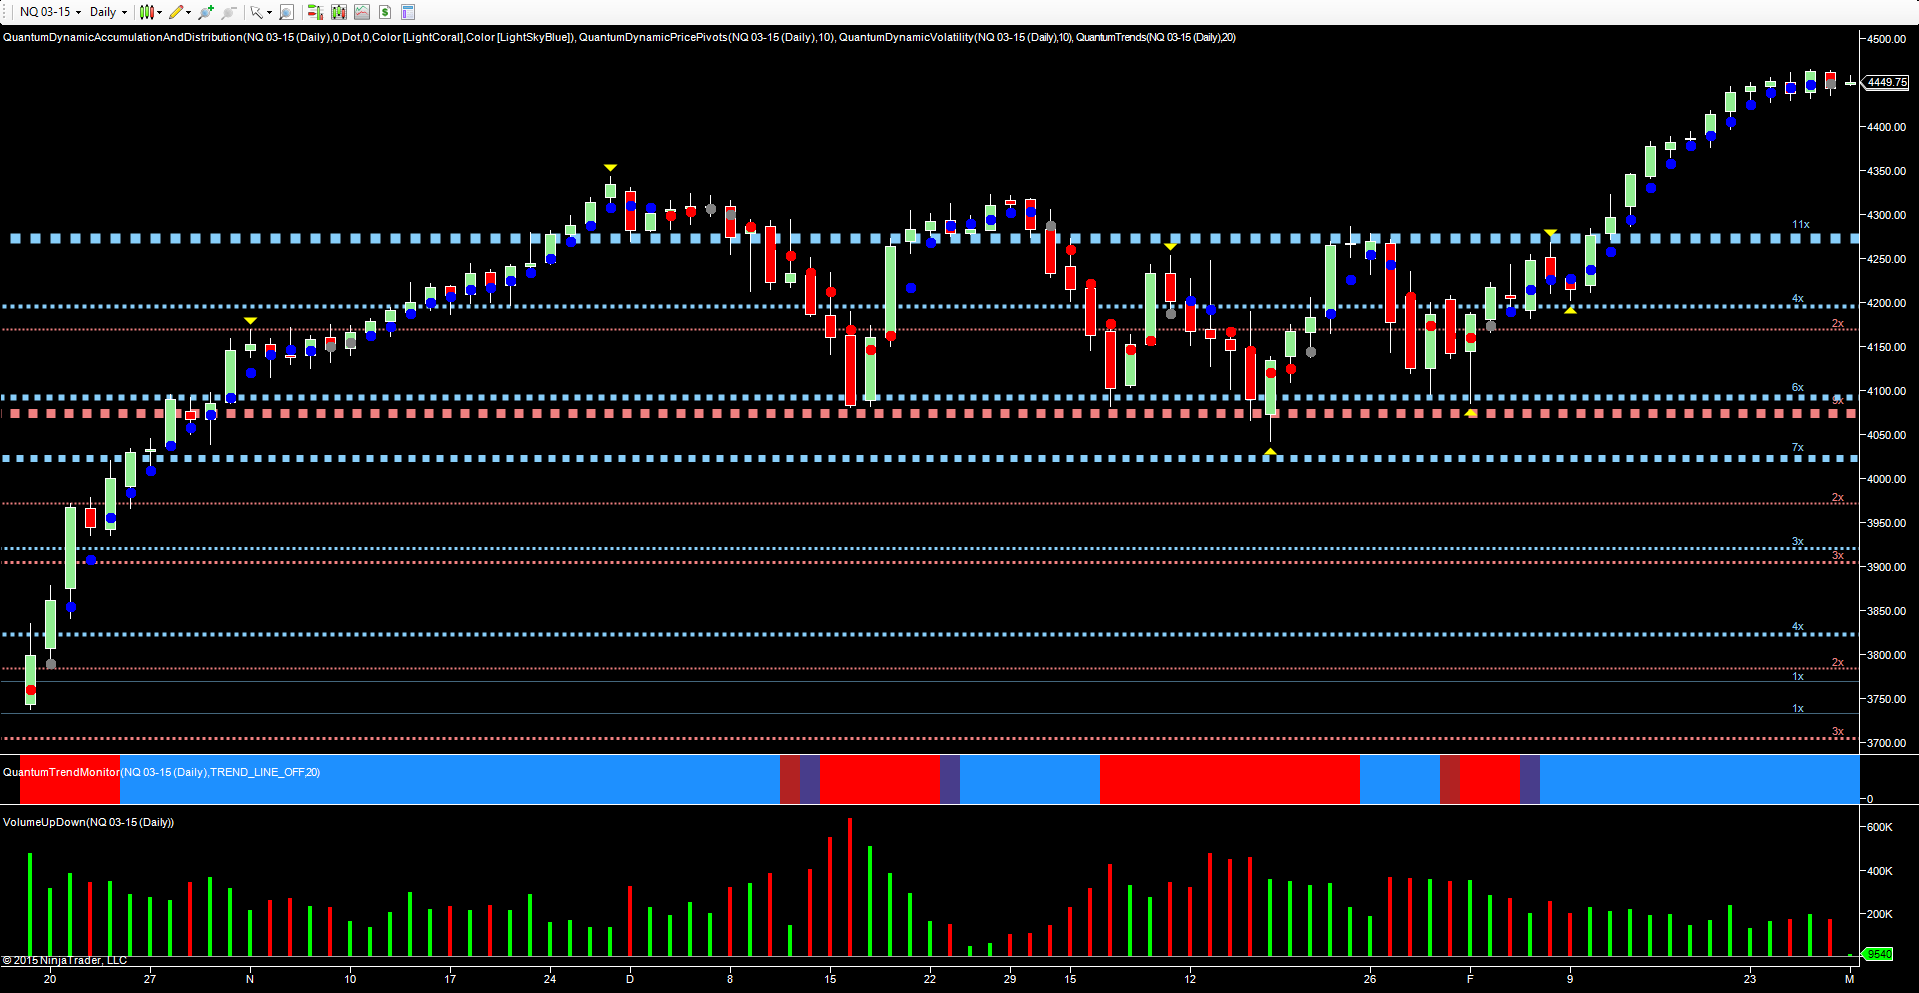
There are times when price action and art become close bedfellows, and this is certainly true of the daily chart for all the principal US indices at present, but perhaps the most descriptive of all is the NQ emini which has been creating one half of a parabolic arch of elegant and classical proportions since the start of last month. Whilst this is indeed a beautiful creation, it does reveal a great deal more, and indeed is reminiscent of similar price action in September and October last year.
The analogy I used there was of an escalator which, having moved from a lower floor to a higher one, was now levelling off, tired and exhausted and lacking momentum. After all, it is the price action alone which is creating this pattern as the spreads narrow and new ground becomes harder to gain. To complete the picture, we then add volume, and the signs here are also suggesting some weakness, with the parabolic price action rising, against a slow but steady decline in volume, a worrying sign. However, I should stress, this is certainly not the start of the ‘big short’ as the price action has not been preceded with any form of selling climax. More likely, this is simply another pause in the longer term bull trend, and given the price and volume profiles it will be no surprise to see the market correct once again, before continuing on its journey higher and picking up momentum in due course.
The decline in trading volumes is no great surprise given where equity markets are at present, with many breaking out into new high ground, and it is at this point that the words of Jessie Livermore echo down the decades as he once said- ‘prices are never too high to begin buying or too low to begin selling’ – wise words and ones we will do well to remember.
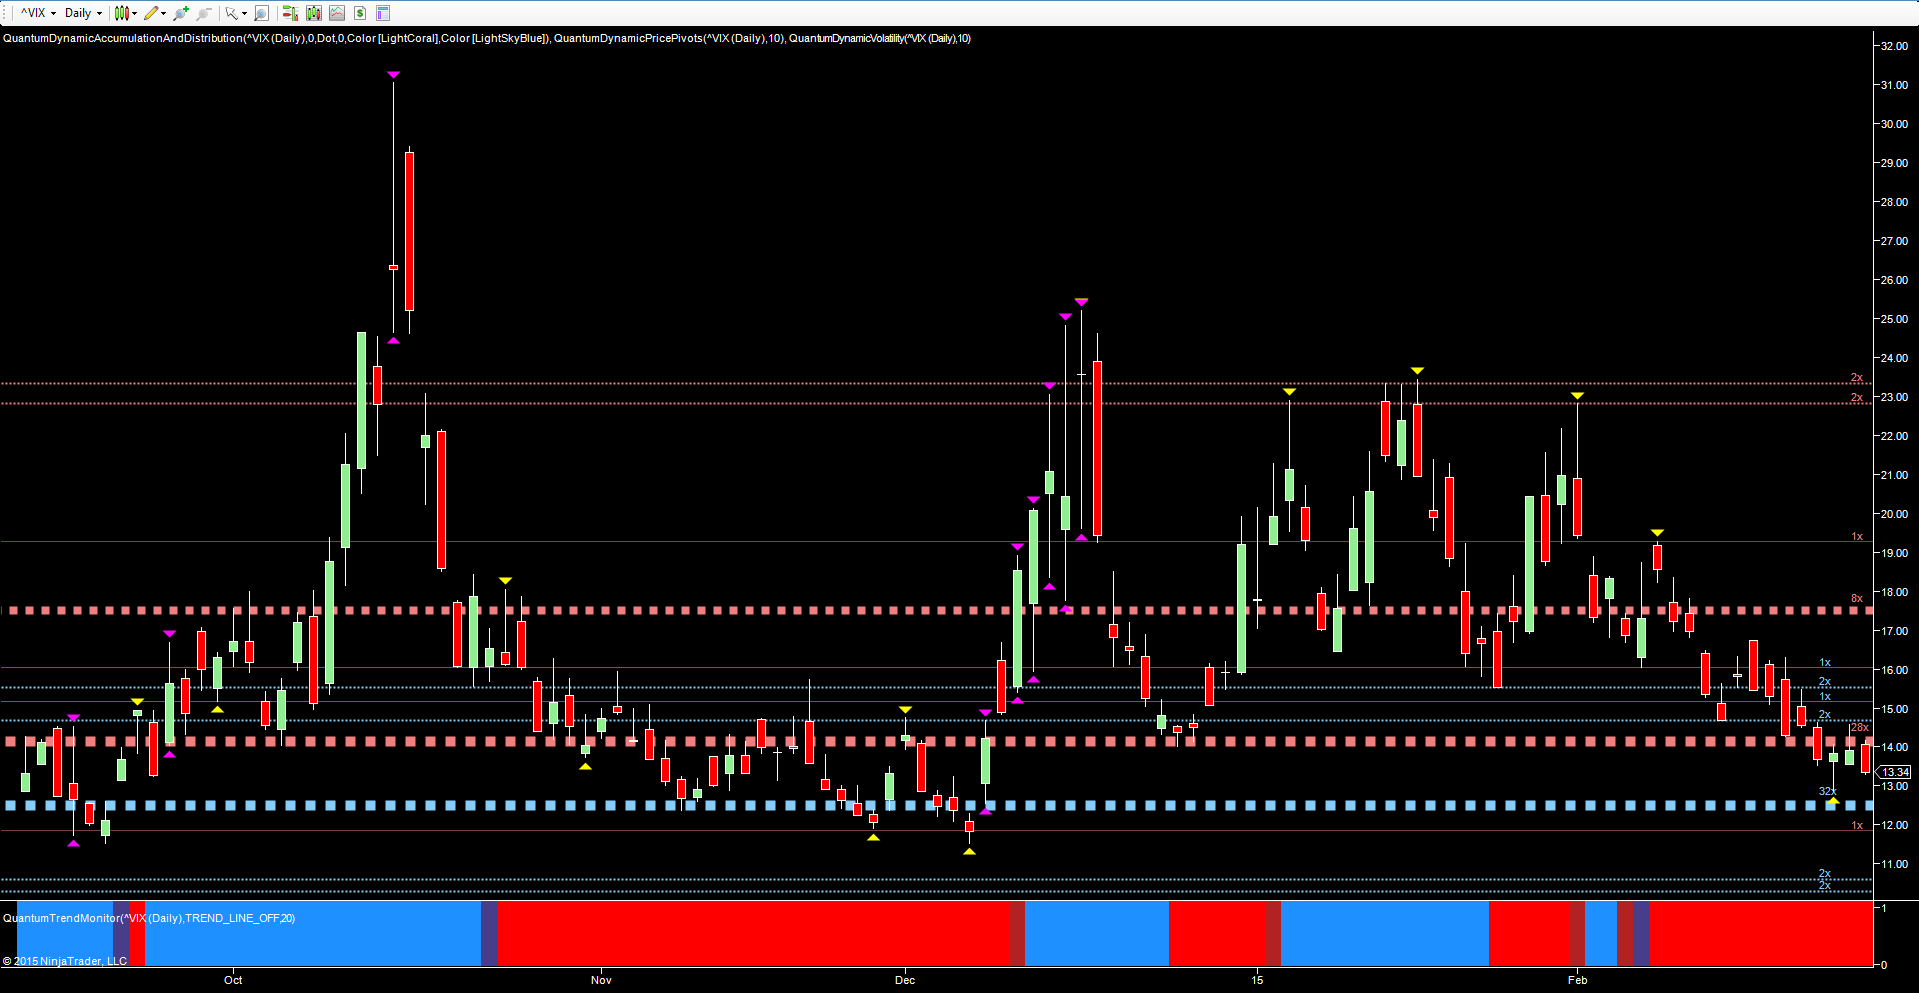
The VIX too is sending its own signals. As always as we approach the lower regions on the index, fear begins to build. From a technical perspective, the index has breached the strong platform of support in the 14 region and is now moving to test the 12.50 area, another deep area of price congestion. Should this hold firm, we could see a bounce higher from here mirroring any short term move lower for equities.
What seems clear is that equity markets at present are following some classical patterns, rising, pausing with rounded tops, falling, and then picking up momentum as the buyers move in once more with renewed confidence and energy, all of which will be validated and reflected in the associated volume profiles. So no big short just yet – but some elegant and classical art, courtesy of the financial markets!

