Just recently my colleague Jesse Felder penned an excellent piece discussing the use of the “four most dangerous words” in investing. The whole article is a must read, but he hit on a particular point that has become a mantra for speculative investors as of late:
In other words, valuations don’t matter as much as they did in the past because ‘this time is different’ in that interest rates are so low.
The basic premise of the interest rate/valuation argument has its roots in the “Fed Model” as promoted by Alan Greenspan during his tenure as Federal Reserve Chairman.
The Fed Model basically states that when the earnings yield on stocks (earnings divided by price) is higher than the Treasury yield; you should be invested in stocks and vice-versa. In other words, disregard valuations and buy yield.
Let me warn you now this will not end well.
There is an important disconnect that needs to be understood.
You receive the income from owning a Treasury bond, however, there is NO tangible return from the earnings yield.
For example, if I own a Treasury bond with a 5% coupon and a stock with a 8% earnings yield, if the price of both assets don’t move for one year – my net return on the bond is 5% while the net return on the stock is 0%.
Which one had the better return?
Yet, analysts keep trotting out this broken model to entice investors to chase an asset class with substantially higher volatility risk and lower returns.
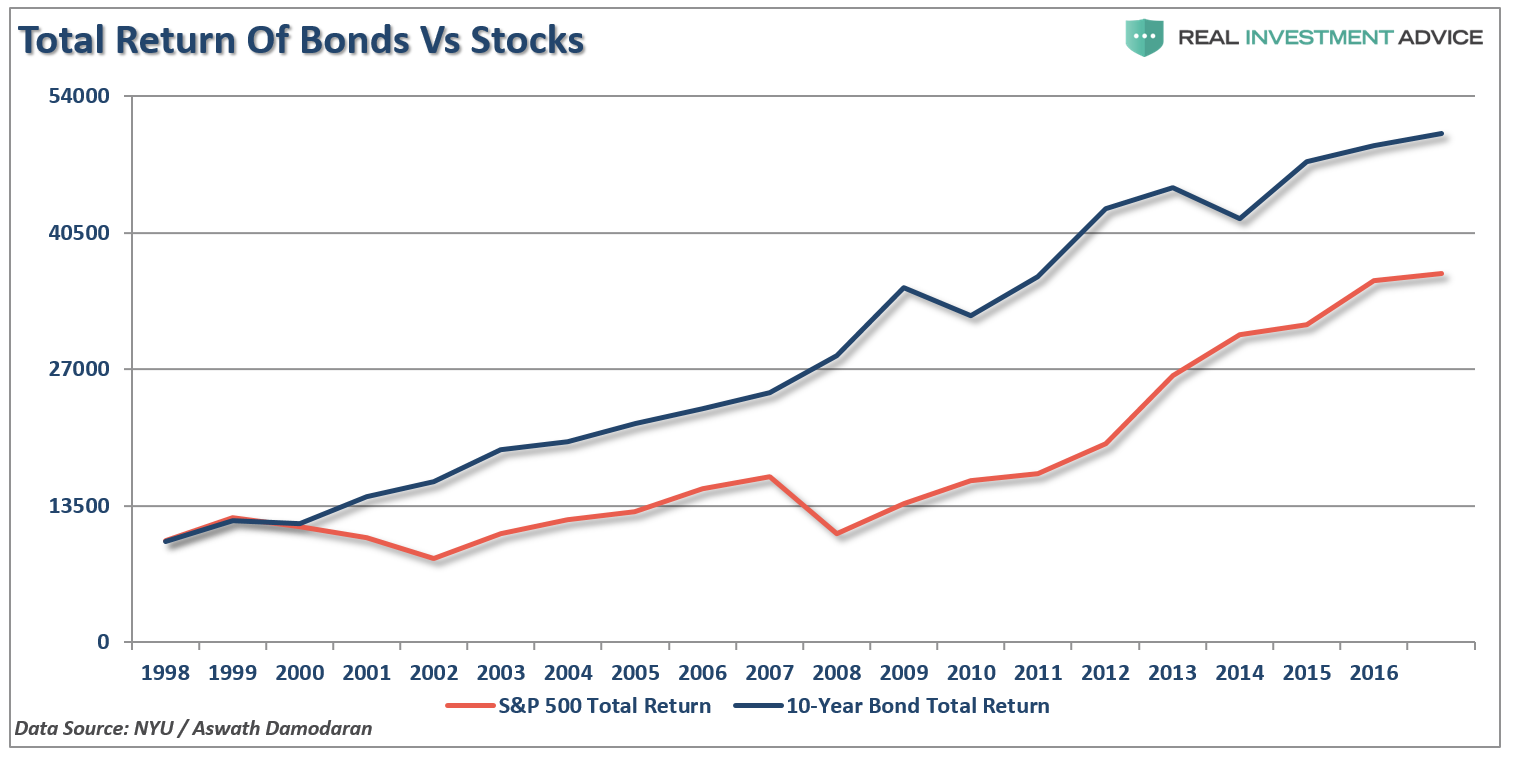
It hasn’t been just since the turn of the century either. An analysis of previous history alone proves this is a very flawed concept and one that should be sent out to pasture sooner rather than later. During the 50s and 60s the model actually worked pretty well as economic growth was strengthening.
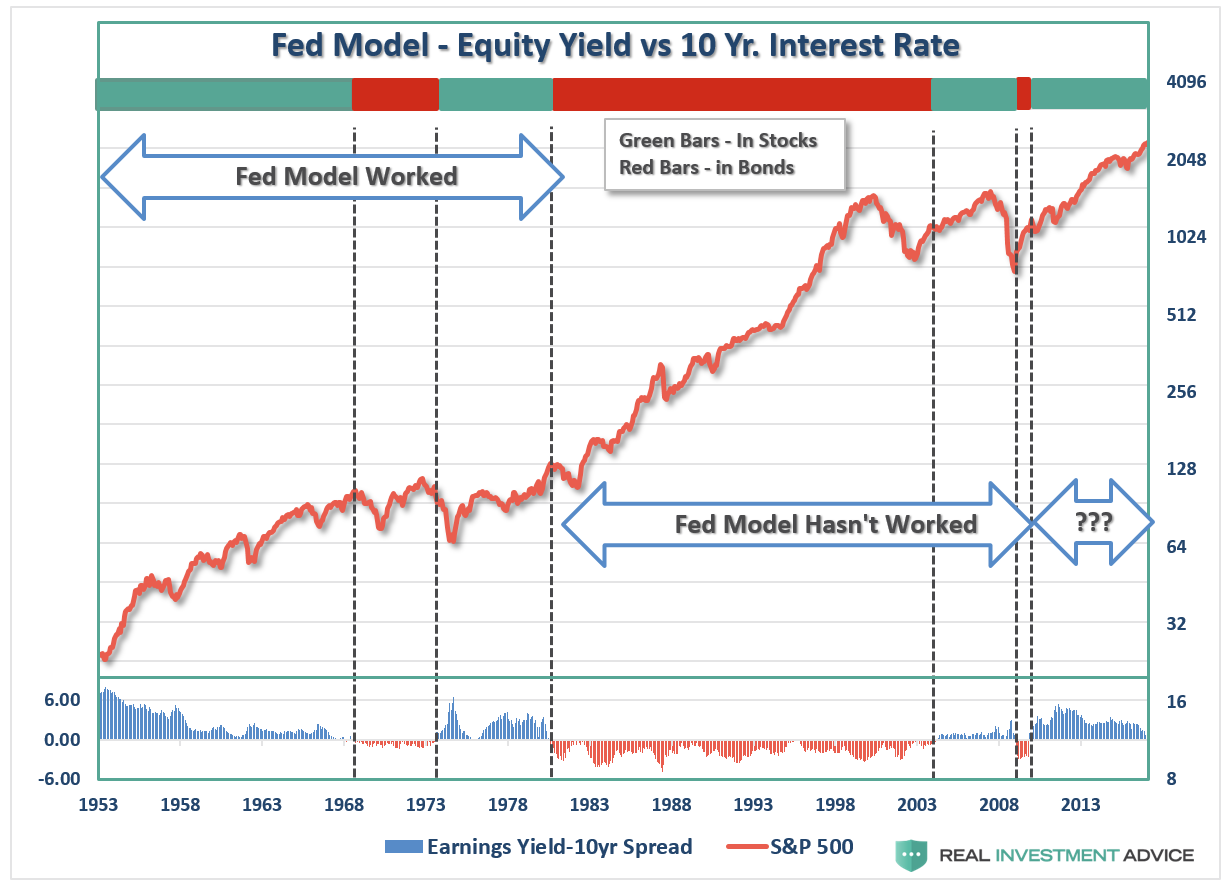
Then, beginning in 1980, as Reagan and Volker set out to break the back of high-interest rates, the model no longer functioned. During the biggest bull market in the history of the markets, you would have sat idly by in Treasuries and watched stocks skyrocket higher.
However, not to despair, the Fed Model did turn in 2003 and signaled a move from bonds back into stocks. Unfortunately, the model also got you out just after you lost all of your gains during the crash of the markets in 2008.
Currently, the model once again seems to be working. However, is the recent decline in interest rates, driven by massive global Central Bank interventions, should be sending a warning signal to investors. The chart below takes the interest rate argument from a little different angle. I have capped interest rates from their “low point” of each interest rate cycle to the next “high point” and then compared it to the S&P 500 index. (The vertical dashed lines mark the peaks in the S&P 500 Index)
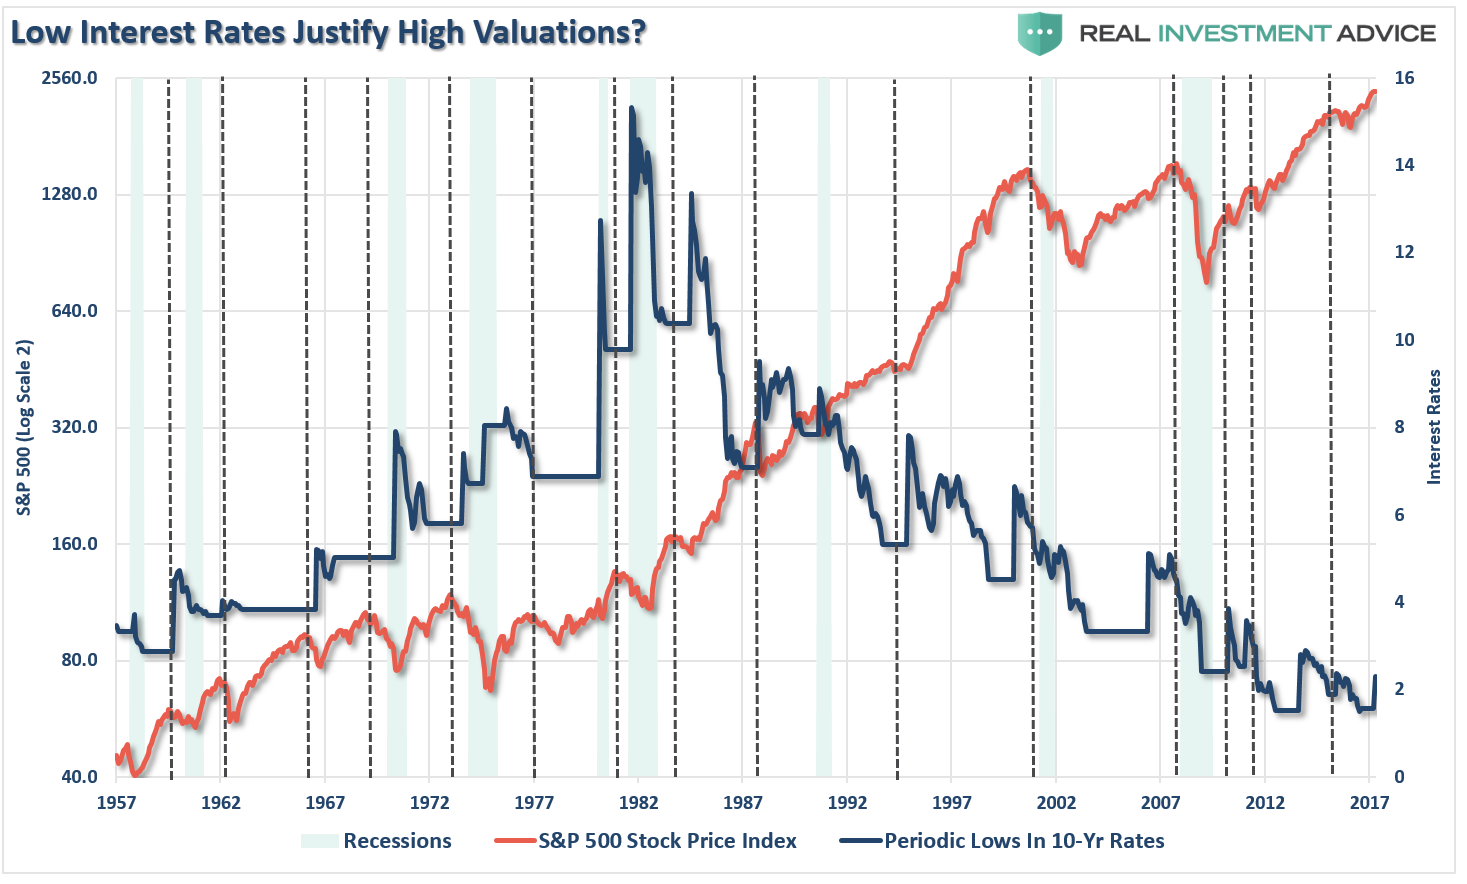
In the majority of cases, the market tends to peak between the low point interest rates for each cycle and the next high point. In other words, a period of steadily rising interest rates is not conducive to higher equity prices.
Cliff Assness, in his 2003 paper on the Fed Model, debunked the three primary arguments for the model as follows:
Refuting Argument #1-The Competing Assets Argument: Argument #1 is that stocks and bonds are competing assets, and thus we should compare their yields. Now we see that the yield on the stock market (E/P) is not its expected return. The nominal expected return on stocks should, all else equal, move one-to-one with bond yields (and entail a risk premium that itself can change over time). But this is accomplished by a change in expected nominal earnings growth, not by changes in E/P.
Refuting Argument #2-The PV Argument. Argument #2 is that when inflation or interest rates fall, the present value of future cash flows from equities rises, and so should their price (their P /E). It is absolutely true that, all else equal, a falling discount rate raises the current price. All is not equal, though. If when inflation declines, future nominal cash flow from equities also falls, this can offset the effect of lower discount rates. Lower discount rates are applied to lower expected cash flows.
The typical ‘common sense’ behind the Fed model ignores this powerful counter-effect, in effect trying to use lower nominal discount rates, but not acknowledging lower nominal growth. You would be hard pressed to find a clearer example of wanting to both have and eat your cake.
It is indeed possible to think of stocks in bond terms as the Fed model attempts. Instead of regarding stocks as a fixed-rate bond with known nominal coupons, one must think of stocks as a floating-rate bond whose coupons will float with nominal earnings growth. In this analogy, the stock market’s P/E is like the price of a floating-rate bond. In most cases, despite moves in interest rates, the price of a floating-rate bond changes little, and likewise the rational P/E for the stock market moves little.
Refuting Argument #3-Just Look at the Data: Historically, when interest rates or inflation are low, the stock market’s E/P is also low, and vice versa. This, Fed modelers say, shows that the market does in fact set the equity market’s P/E as a function of the bond yield, implying the Fed model is a good tool for making investment choices.
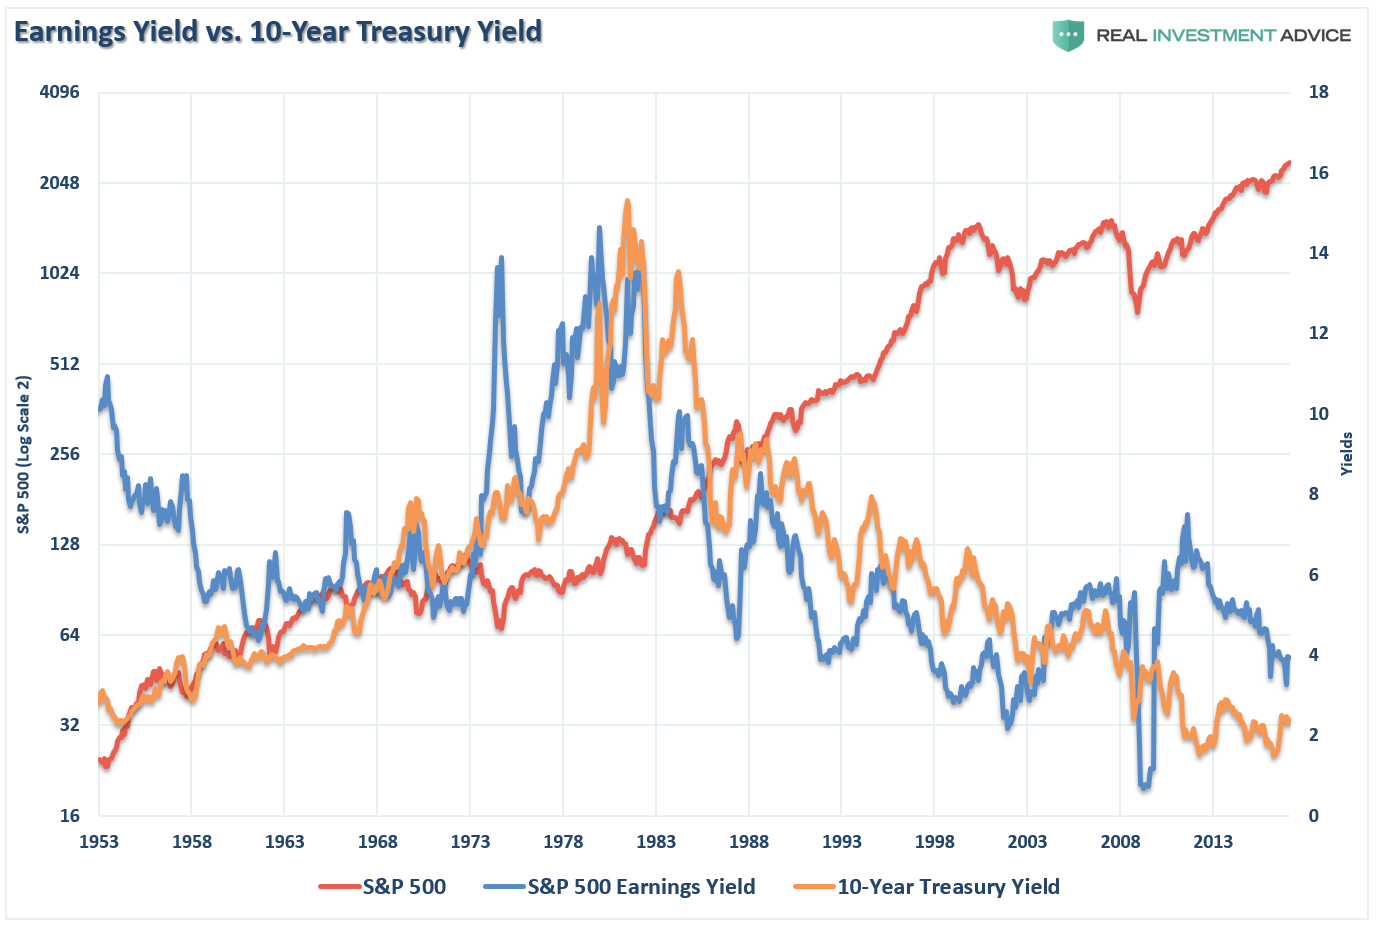
Pundits using this.argument assume that because they show that P/Es are usually high (low) when inflation or interest rates are low (high), the Fed model is necessarily a reasonable tool for making investment decisions. This is not the case. If investors mistakenly set the market’s P/E as a function of inflation or nominal interest rates, then the chart above is just documenting this error, not justifying it.
A simple analogy might be helpful. Say you can successfully show that teenagers usually drive recklessly after they have been drinking. This is potentially useful to know. But, it does not mean that when you observe them drinking, you should then blithely recommend reckless driving to them, simply because that is what usually occurs next. Similarly, the fact that investors drunk on low-interest rates usually pay a recklessly high P/E for the stock market (the Fed model as descriptive tool) does not make such a purchase a good idea, or imply that pundits should recommend this typical behavior (the Fed model as forecasting/ allocation tool).
The pundits often confuse these two very different tasks put to the Fed model. They often demonstrate (each with a particular favored graph or table) that P/Es and interest rates move together contemporaneously. They then jump to the conclusion that they have proven that these measures should move together, and investors are thus safe buying stocks at a very high market P/E when nominal interest rates are low.
They are mistaken. The Fed model, in its descriptive form, documents a consistent investor error (or a strange pattern in investors’ taste for risk); it does not justify or recommend that error.
So, when pundits say it is a good time for long-term investors to buy stocks because interest rates are low, and then show you something like chart above to prove their point, please watch the tense of what they say, as what they often really mean is that it WAS a good time to buy stocks ten years ago, as investors are now paying a very high P/E for the stock market (perhaps fooled into doing so by low interest rates as I contend), and the story going forward may be painfully different.”
The last point is crucially important. As shown in the chart below, which compares earnings yield to forward 10-year real returns, when E/Y has been near current levels the return over the next 10-years has been quite dismal, to say the least.
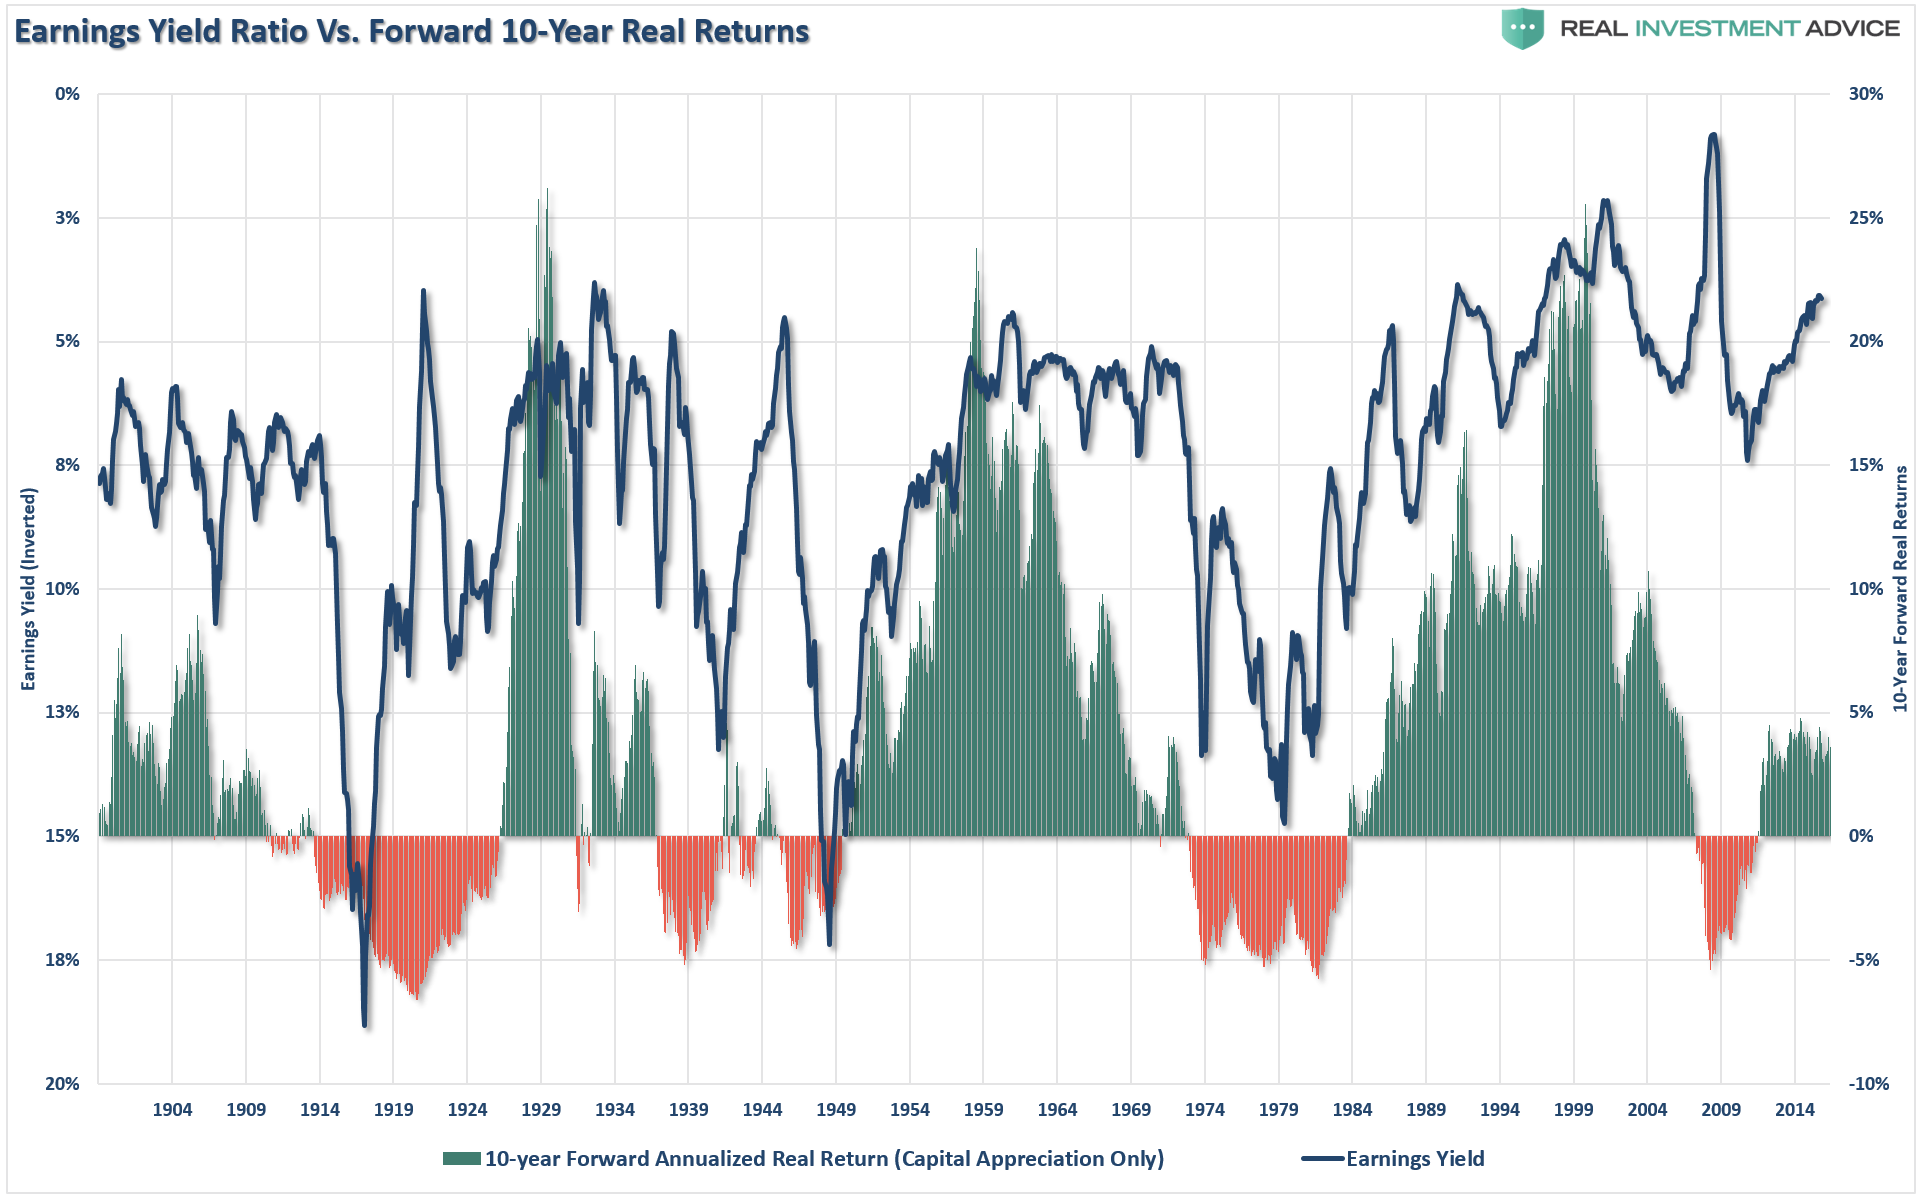
Importantly, it is imperative to remember that earnings yields, P/E ratios, and other valuation measures are important things to consider when making any investment as they are very predictive of long-term returns from the investment. However, they are horrible timing indicators.
As a long term, fundamental value investor, these are the things I look for when trying to determine “WHAT” to buy. However, understanding market cycles, risk/reward measurements, and investor psychology is crucial in determining “WHEN” to make an investment.
In other words, I can buy fundamentally cheap stocks all day long but if I am buying at the top of a market cycle I will still lose money.
As with anything in life – half of the key to long term success is timing.
While there is much to debate about the current level of interest rates and future stock market returns, it is clear is the 30-year decline in rates did not mitigate two extremely nasty bear markets since 1998, just as falling rates did not mitigate the crash in 1929 and the subsequent depression.
Do low-interest rates justify high valuations?
History suggests not. It is likely a trap which will once again leave investors with the four “B’s” following the next recession – Beaten, Battered, Bruised and Broke.
Never forget, things change – Lowell Miller
