Alongside the GDP and labor market’s strength, inflation rate is the most important macroeconomic indicator – since the Fed promotes full employment and price stability. The price stability is measured as the inflation rate, so inflation reports are closely watched by the U.S. central bank and investors. In the August Market Overview, we showed that Gold is not always an inflation hedge. At that time, we focused on the Consumer Price Index, which is not the only measure of inflation. The others are the Personal Consumption Expenditures Price Index (PCEPI) and the Producer Price Index (PPI).
Let’s start our analysis with the impact of the PCEPI on the gold market. The PCEPI is a part of a Personal Income and Outlays Report issued monthly by the Bureau of Economic Analysis, and is the Fed’s preferred measure of inflation. However, it is the CPI that counts for the markets, as it is released earlier than the PCEPI. This is why the release of the latter indicator provokes a weaker reaction in the gold market.
The official switch from CPI to PCEPI happened in 2000 when the Federal Open Market Committee stopped publishing CPI forecasts and began making its inflation projections based on PCEPI. Why is the latter the Fed’s favorite index? The main reason is that PCEPI changes the weights in the consumer basket every month, i.e. much more often than CPI does. Moreover, PCEPI has a broader scope and its weights are based on (allegedly) more comprehensive measures, and it assigns much less weight to rent and housing and much more to health care.
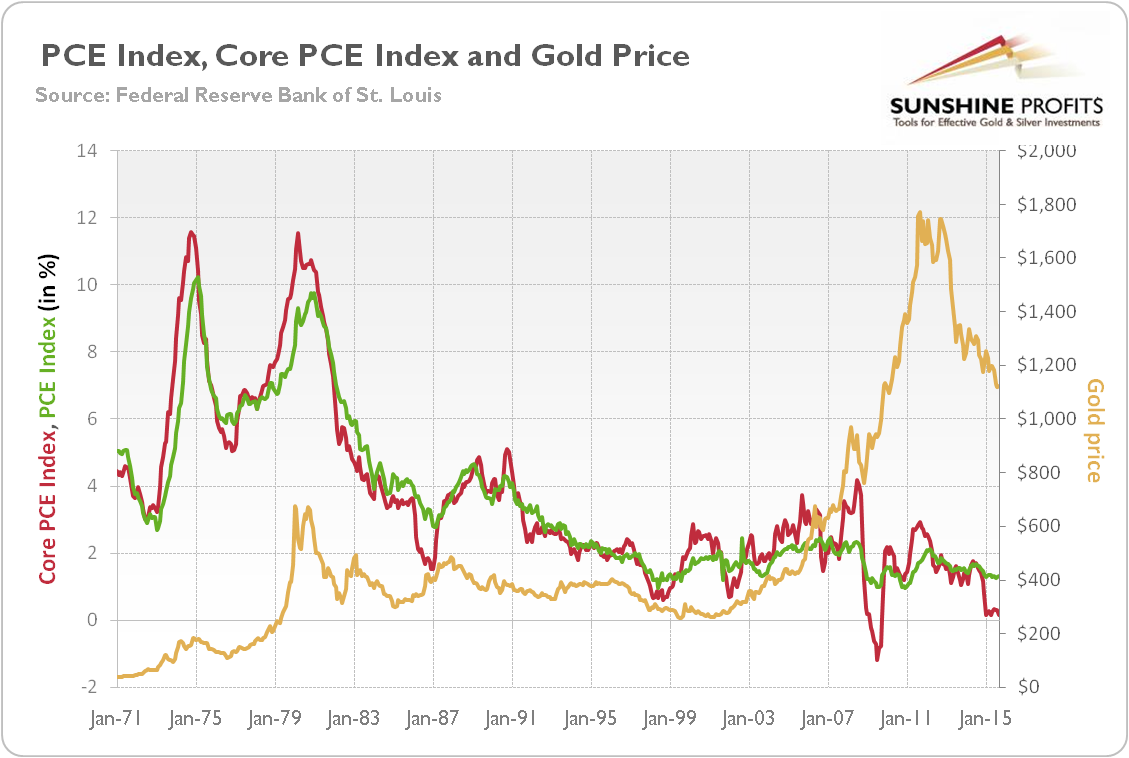
How the PCEPI and its core version (which excludes volatile energy and food prices) are correlated with the price of gold? Let’s analyze the chart below.
Chart 1: The Personal Consumption Expenditures Price Index (green line, left scale), the core Personal Consumption Expenditures Price Index (red line, left scale) and the price of gold (yellow line, right scale, London P.M. fixing) from 1971 to 2015

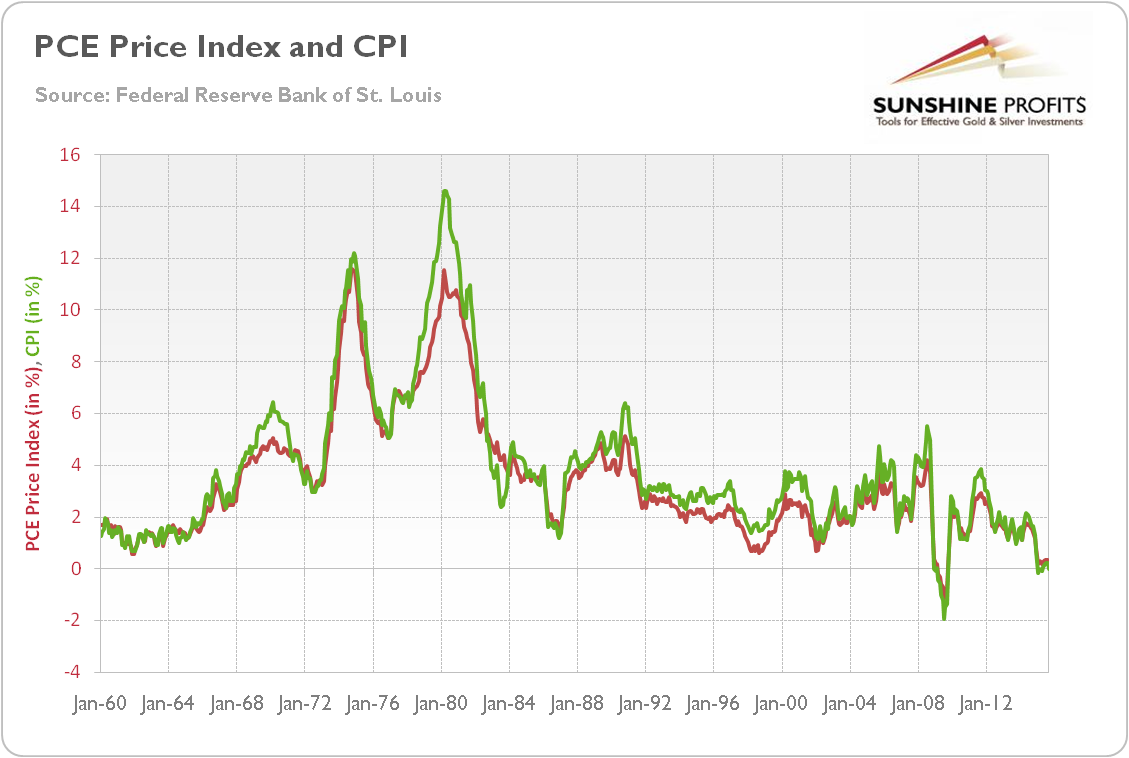
As one can see, there is a similar relationship as with CPI. The shiny metal is not an effective hedge against inflation measured by PCEPI or its core version for short- and medium-term horizons. The price of gold was declining in the 1980s and the 1990s, although the inflation rate at the time was positive. However, there is a relationship between the price of gold and the acceleration and deceleration of the inflation rate. Indeed, the gold prices were increasing in the 70s, when the inflation rate was high and accelerating. Respectively, they were decreasing in the 80s and the 90s when the inflation rate was declining. The very same link to gold should not come as a surprise if we realize that PCEPI shows very similar dynamics to CPI (see the chart below).
Chart 2: The Personal Consumer Expenditures Price Index (red line) and the Consumer Price Index (green line) from 1960 to 2015 (as a percent change from the year ago)

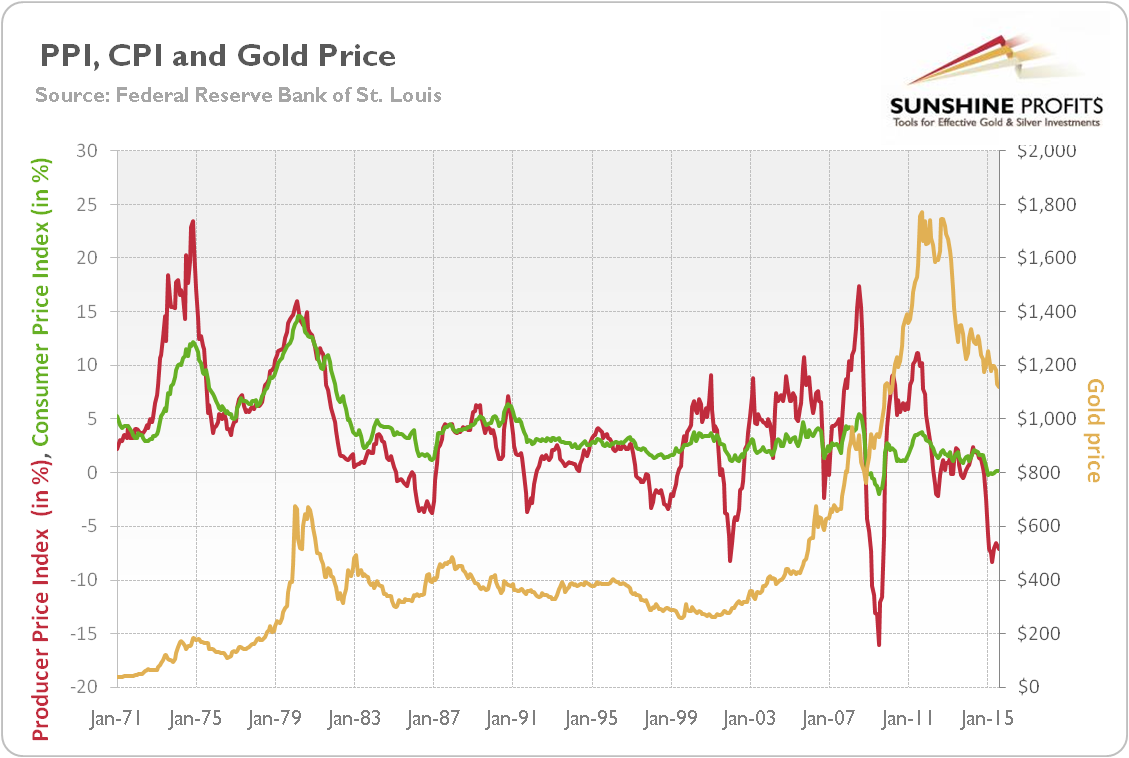
Another important inflation gauge is the Producer Price Index. As its name suggests, PPI is an index of prices at the producer, not consumer level. Therefore, one could say that this indicator is irrelevant since the Fed is concerned with price stability understood as stable prices for consumers. This is true, but PPI is closely watched by the U.S. central bank and the investors in order to predict CPI, which is released a few days after PPI. Let’s examine the relationship between the producer price inflation and gold’s performance.
Chart 3: The Producer Price Index (red line, left scale), the Consumer Price Index (green line, left scale) and the price of gold (yellow line, right scale, London P.M. fixing) from 1971 to 2015

The chart above shows a much stronger relationship between PPI and the yellow metal than in case of CPI. This makes perfect sense, given the fact that PPI is the leading indicator of CPI, and it is also more sensitive to the business cycle as it tracks price changes at the wholesale level. The annual percent changes of PPI are quite volatile, but in the long-term this indicator moved in the opposite direction to the price of gold. Generally, the inflation rate of producer prices was rising in the 1970s and the 2000s, and declining in the 1980s, the 1990s, and the 2010s. Rohan Christie David et al. confirmed in “Do Macroeconomic News Releases Affect Gold and Silver Prices” that the announcements of the PPI have significant effects on gold. Please notice the recent declines in PPI, which clearly signal some deflationary pressure. We currently live in the not so gold-friendly environment – deflation increases the real interest rates.
The key takeaway is that the yellow metal is a hedge against price increases but only if inflation rate is strong and accelerating. The Fed prefers Personal Consumption Expenditures Price Index (and its core version) as inflation gauges, but the index shows very similar dynamics to CPI, and thus the relationship with the price of gold. The Producer Price Index seems to have the strongest relationship with gold, partially due its sensitivity to the business cycle and partially due to the fact that it is earliest released. Therefore, investors who believe that gold trade is generally about the inflation (which is only sometimes true) may take advantage of the short-term gold trading opportunities related to the releases of PPI.
