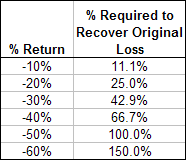
An attractive aspect of owning dividend paying stocks, specifically, dividend growth equities, is the fact they tend to hold up better in down market environments. The favorable result from this characteristic is it takes a smaller upside return to make up the losses incurred in a market decline. 
As far back as 2010 I wrote about this favorable feature in a post, Comprehensive Review Of The Dividend Aristocrats. As noted in that article, in shorter time frames, the dividend aristocrats did exhibit a higher standard deviation, yet the total return of the aristocrats was higher than the broader S&P 500 Index and resulted in the aristocrats having a higher Sharpe ratio. A part of this is attributable to the favorable compounding impact of reinvested dividends.
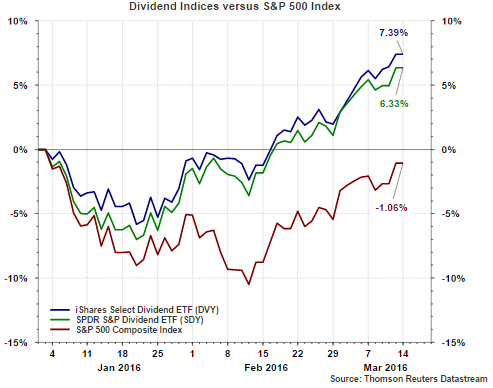
As we fast forward to today and the recent downturn in the equity markets from early last year, the favorable performance of dividend paying stocks is once again evident. For the year to date period both the iShares Select Dividend (NYSE:DVY) and the SPDR S&P Dividend (NYSE:SDY) are outperforming the S&P 500 Index as seen in the below chart. During the market pullback from 12/31/2015 through February 11, 2016, the dividend focused ETFs held up significantly better than the S&P 500 Index itself. As the market has recovered, the dividend paying indexes are maintaining their outperformance and have recovered the losses incurred in the pullback. 
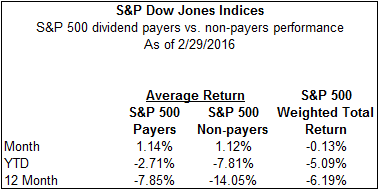
And finally, just looking at all the dividend paying stocks in the S&P 500 Index, for the first two months of the year, S&P Dow Jones Indices reports the average return of the payers was down 2.71% versus the non-payers being down 7.81%. 
Source: S&P Dow Jones Indices
As investors evaluate dividend strategies, they are cautioned that each is different in significant ways. For example, the iShares Select Dividend ETF (DVY) has 34% of its stock weighting allocated to the utilities sector while at the same time having only 2% exposed to technology. The SPDR S&P Dividend (NYSE:SDY) is a bit less concentrated as utilities account for 11% of its stock weighting. The largest sector exposure is financials at 24%. Again, similar to DVY, the technology sector weighting is only 2%. For comparison purposes the broader S&P 500 Index has a 21% weighting in technology and a 3% weighting in utilities.
The attractive aspect of investing in dividend paying investments is their favorable qualities exhibited in down markets. Conversely, in a market that is tilted towards 'risk-on' the dividend paying stocks do have the propensity to trail the broader market as can be seen in my earlier post covering the dividend aristocrats.
