Talking Points:
-Finding Divergence
-Finding a Trigger
-Set Levels & Relax
"If you must play decide upon 3 things at the start: the rules of the game, stakes and quitting time."
-Michael Covel
"I believe the very best money is made at the market turns. Everyone says you get killed trying to pick tops and bottoms and you make all your money by playing the trend in the middle. Well for twelve years I have been missing the meat in the middle but I have made a lot of money at tops and bottoms."
-Paul Tudor Jones
Trading divergence is exciting but like a lot things that have a high pay-off, it should be executed carefully. We’ll define carefully as having a clear plan as to what the appropriate set-ups looks like, finding a level that shows other traders may recognize the trend reversal as well and lastly, the levels that we will exit on for either a protective stop or profit target.
Finding Divergence
Learn Forex: Divergence worth Trading Is Easy to Find

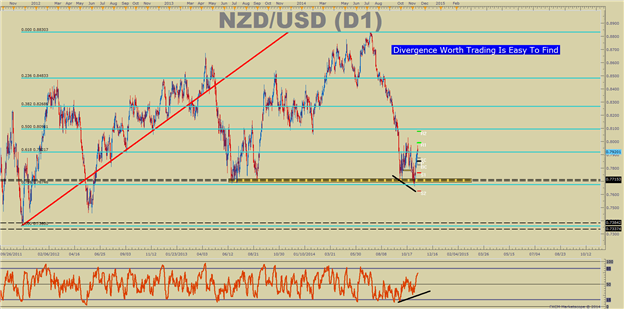
Finding divergence only requires two things on the chart and time frame of your choosing. First, you must find a trend that is looking tired. A tired trend is one where a new high is weak or barely breaking above the prior high. Second, you should find momentum stalling in the direction of the trend or accelerating against the trend with the help of an oscillator like the Relative Strength Index or RSI. Other oscillators like MACD, Slow Stochastics or Rate of Change can work well too as long they show you that the force behind the prior trend is slowing down.
Above, you can see that divergence aligning with other technical tools can help find a worthy set-up. The NZD/USD chart shows two technical signals in addition to divergence. First, price bounced off the 0.7700 level again which has held since the push higher in 2012. Second, the 78.6% Fibonacci level can act as support preventing a lower low and potentially a nice trade.
Finding a Trigger
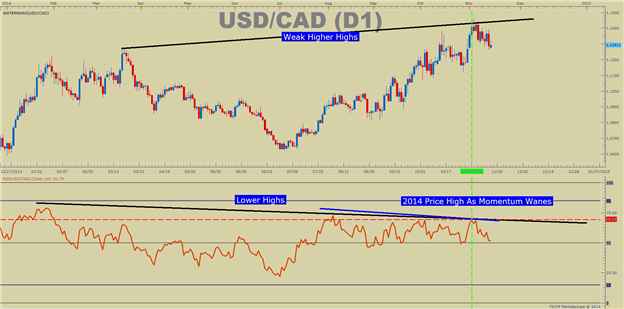
Once you’ve found a worthy chart, you should find a trigger. Another word for trigger could be a confirmation move. Basically, you want to see a break of resistance on a smaller scale if you’re looking to buy or support if you’re looking to sell. Given how large the FX market it, it’s best to react rather than predict, and reacting to a move at the onset of that move could be a favorable play. The chart we’ll look at today for a walkthrough is USD/CAD. Therefore, after we’ve identified divergence, we need to see what level would show that other traders are going the route we’re thinking as well.
Learn forex: USD/CAD Meets Our Requirements for Divergence Trading

Please note, confirmation is a helpful tool but it does not guarantee profitability. It’s easy to see this concept as a master key to trading well but it simply allows others in the market to confirm the move before you take the risk. In the end, risk management will always remain the key to successful trading.
Set Levels & Relax
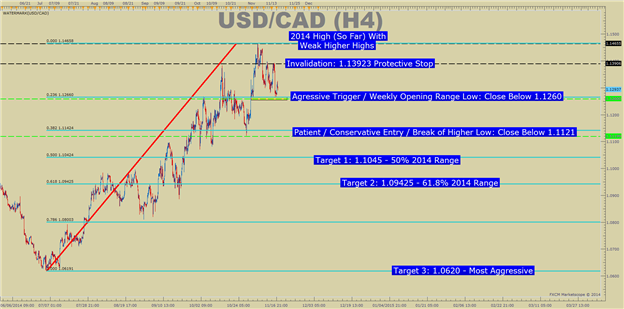
Once you’ve found a chart and a trigger you then only need to find two levels. First, a level to exit should the trade not work out also known as a protective stop because it protects your account from a large drawdown. Many traders prefer to keep this tight so that they’re risk: reward remains favorable. An acceptable level would not be a new price extreme but rather a lower high if you’re looking to sell like in the USD/CAD example. Let’s zoom in on USD/CAD to get some levels as an example.
Learn Forex: Once the Levels Are Set, You Can Let the Market Do the Rest

Second, you need to find acceptable exits should the trade work out in your favor. The two tools that can be used to find profit targets rather easily could be prior price extremes or Fibonacci levels. Prior price extremes are favorable because Fibonacci can be more subjective and prior extremes tend to hold in strong trends like the one we’re trading. Either way, a tradable plan should include entry triggers, exits and profit targets after divergence is found.
