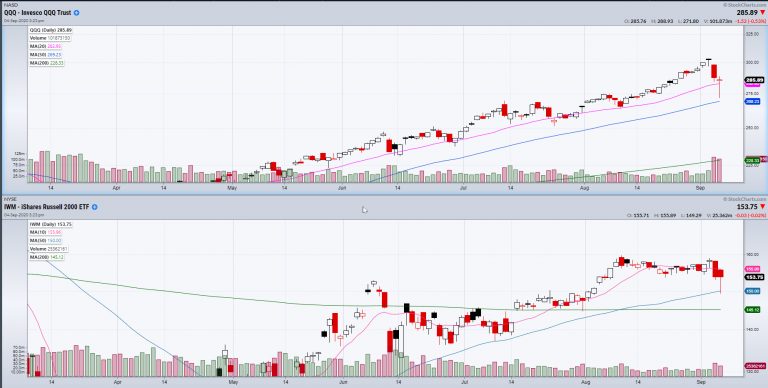
After 2 major sell-off days, the market bounced late Friday off the 50-day moving average.
Coincidence?

First, why do we care about the 50-day moving average?
The most common inputs for the Moving Average used by traders and market analysts are the 50, 100, and the 200 DMA.
Knowing a large amount of people and institutions watch these levels, makes for a self-fulfilling prophecy when price reacts to these averages.
While there are plenty of times moving averages are broken and phases change as a result, Friday’s test of the 50-DMA in many instruments has weight.
Here we have the QQQ (NASDAQ) and the IWM ({{|Russel 2000}}) both pulling back after Thursday and Friday’s large sell-off.
While IWM touched the 50 and the QQQs only came close, I use the 50 DMA price more as a range looking for confirmation over the course of two days.
If the QQQs and IWM hold Friday’s low, we not only had a perfect 10% correction, but we also did not see a phase change from bullish to caution.
Now if these symbols are not making enough of a convincing point then let us look further!

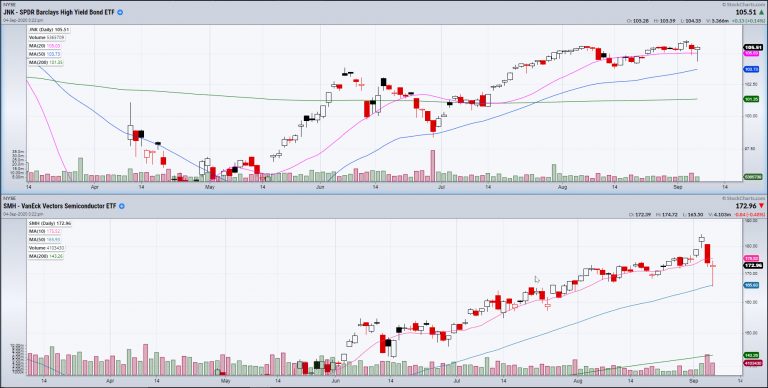
Here we have JNK and SHM. JNK represents high yield debt.
It is the riskier type of debt that might keep you up at night. Even so, look at how high it has gone. More importantly, it never crashed with the market, holding up way better.
Apparently, there is still good appetite for buying Junk.
Now SMH almost perfectly touched the 50 and bounced off of it to close near where the day opened.
With the great rise in tech stocks since 2012, SMH (semiconductors) has been a good one to keep eyes on.
With these major symbols coming so close to the 50 DMA and finding buyers and support, they have created a good sense of what we should look for next week depending on if they hold or break through the moving averages.
Watch for the 50-DMA to become a place of support with an expectation that the markets will move higher.
Or, watch to see if we head back towards the 50-DMA for a potential break and a larger correction in the market.
Either way, it has created a level for us to watch closely, helping us to better control risk in these volatile times.
S&P 500 (SPY) 329 support 348 resistance
Russell 2000 (IWM) 149 support 160 resistance
Dow (DIA) 275 support 292 key resistance
Nasdaq (QQQ) 269 key support
KRE (Regional Banks) 38 key support 40 pivotal.
SMH (Semiconductors) 165 new support 50-DMA 178 resistance
IYT (Transportation) Watching for a run back over the 10 DMA with resistance at 203 support at 198
IBB (Biotechnology) Close pullback from 200-DMA Look for a move back to 130-136 range
XRT (Retail) Next support at 50-DMA 48.00 if 50 cannot hold
Volatility Index (VXX) Watching support at the 50 and 200 DMA level around 28.00
Junk Bonds (JNK) 104-105 support range
LQD (iShs iBoxx High yield Bonds) 134.56 next support
GLD (Gold Trust) Held 180 support perfectly
GDX (Gold Miners) Closed over 50-DMA Looking to continue up over 10-DMA
