If oil has been leading the broad markets lower, should it find support at $84 and reverse, that could presage a reversal in the broader market.
Did the sharp sell-off in oil trigger the meltdown in stocks? While there are plenty of potential reasons for the stock market to drop--stretched valuations, the slowdown in Germany, Japan and China, etc.--it occurred to me that the recent sell-off in crude oil might have served as a trigger.
Any sell-off in a sector that represents a significant share of the stock market has the potential to trigger more selling, which then begets more selling. Energy is a sector that is generally well-represented in institutional holdings and mutual funds.
Once oil broke key supports, institutional money managers reading projections of $60/barrel oil apparently decided to exit oil and oil services en masse.
Given the weight of this sector in portfolios, mass unloading of oil stocks would negatively impact the entire S&P 500. If oil being dumped caused the market to breach key technical levels, that would cause managers to trim risk-on portfolios. This selling would then beget more selling as the downtrend gathered momentum.
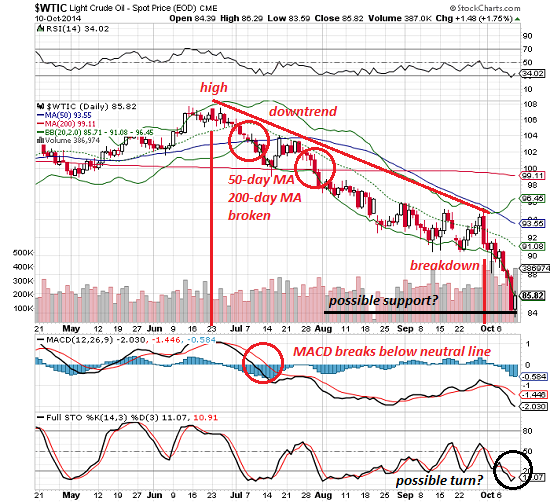
We can look for some correlation by comparing the charts of WTIC (crude oil) and SPX (S&P 500). Oil topped in June and rolled over into a downturn that gathered momentum once the 50-day moving average (breached in early July) and 200-day moving average (breached at the end of July) gave way.
An attempted reversal in crude oil failed in late September, ushering in a brutal $10 cascade down to the $84 level.

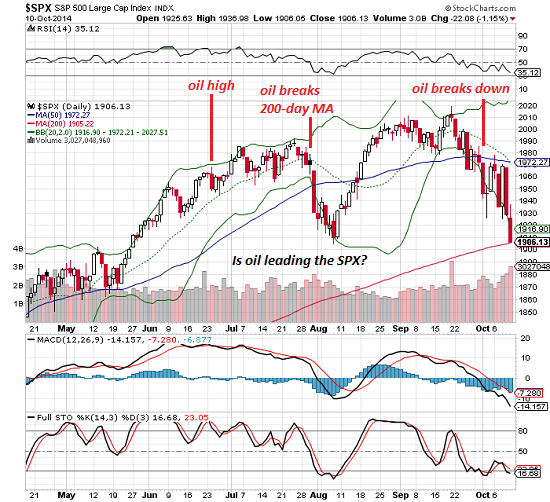
Interestingly, though the SPX continued slogging higher after oil rolled over, the MACD of SPX began declining in July along with oil.
Shortly after oil broke its critical 200-day moving average, the S&P 500 suffered a cascading downturn that sliced right through its 50-day MA.
As oil continued its slide, the SPX recovered and reached new highs. But once oil broke down in late September, the SPX started wobbling. Once it lost its 50-day MA, it yo-yo'ed violently for a few days and then broke down to its 200-day moving average.

Crude oil has declined to possible support around $84, and the stochastic has turned up, signaling a potential reversal.
If oil has been leading the broad markets lower, should it find support at $84 and reverse, that could presage a reversal in the broader market.
This correlation is of course very speculative and may turn out to be a mere mote in my eye. Nonetheless, it bears watching WTIC in the weeks ahead to see if its turns continue to impact the broader market's direction.
