
Key Highlights For Mar 12, 2019.
- The price of Bitcoin (BTC) rose along an upward trend from Mar 4 and Mar 11, 2019.
- The price broke down from its support line on Mar 12.
- There is some bullish divergence developing in the RSI and the MACD.
- The price is trading inside the support area near $3840.
- A second support area can be found near $3720.
- There are resistance areas near $4160 and $3970.
A Breakdown
The price of BTC on Binance is analyzed at 30-minute intervals from Mar 4 to Mar 11. During this time the price made successively higher lows. Tracing these lows gives us the ascending support line.
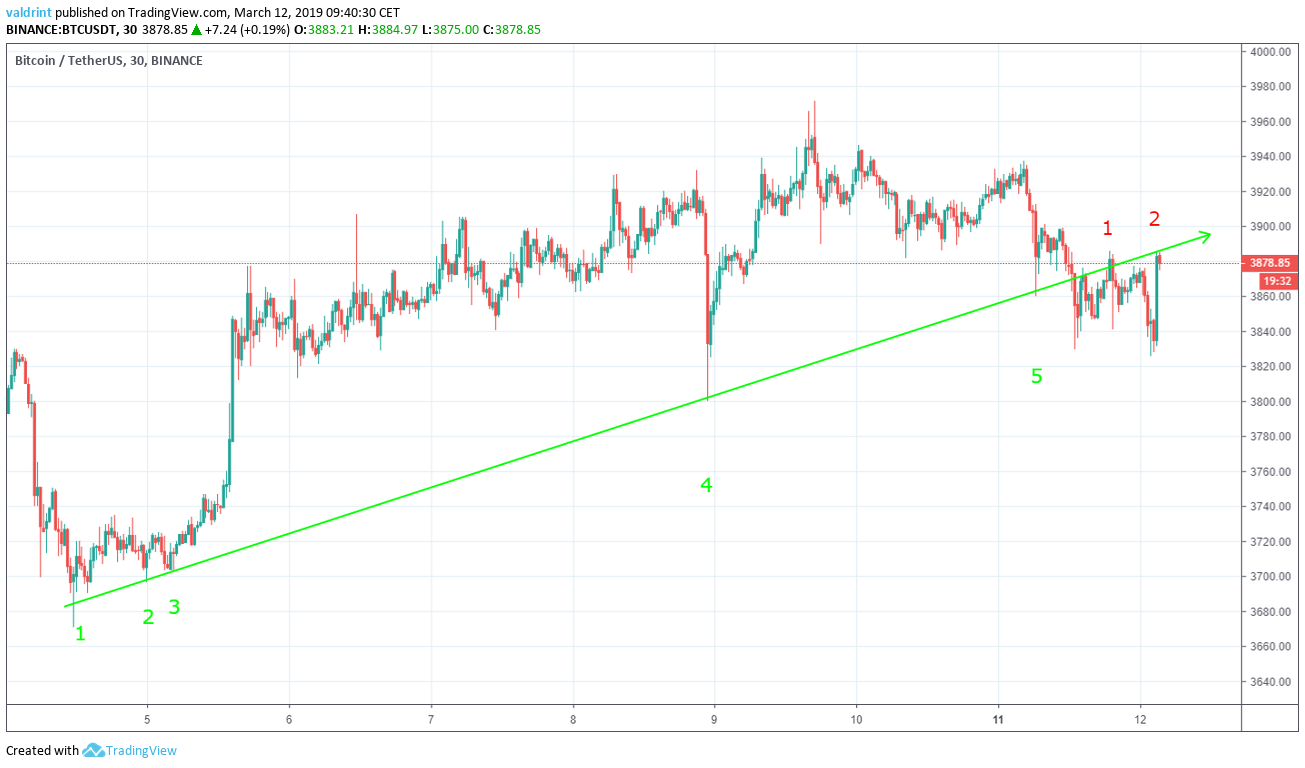
The support line can act as a floor to price, preventing further downward movement. However, in the case of a breakdown, a rapid price decrease can begin. A breakdown occurs when the price drops below the support for a sustained period of time.
In a price analysis for Bitcoin completed on Mar 11, we predicted that a breakdown below the support was likely forthcoming. This prediction was proven true several hours after the analysis was completed.
The breakdown below support means that the price will eventually create new support and resistance levels. While the former support is currently acting as resistance, this may change. Entirely new resistance and support lines will likely be formed in the near future.
Previous Resistance
Price initiated a rapid upward move on Mar 5. It made a swing high of $3877.10. It has made higher highs since. Tracing these highs gives us an ascending resistance line. After the breakdown, the resistance line traced below was no longer an accurate marker of BTC’s upper price limits requiring the former support to become the new resistance.
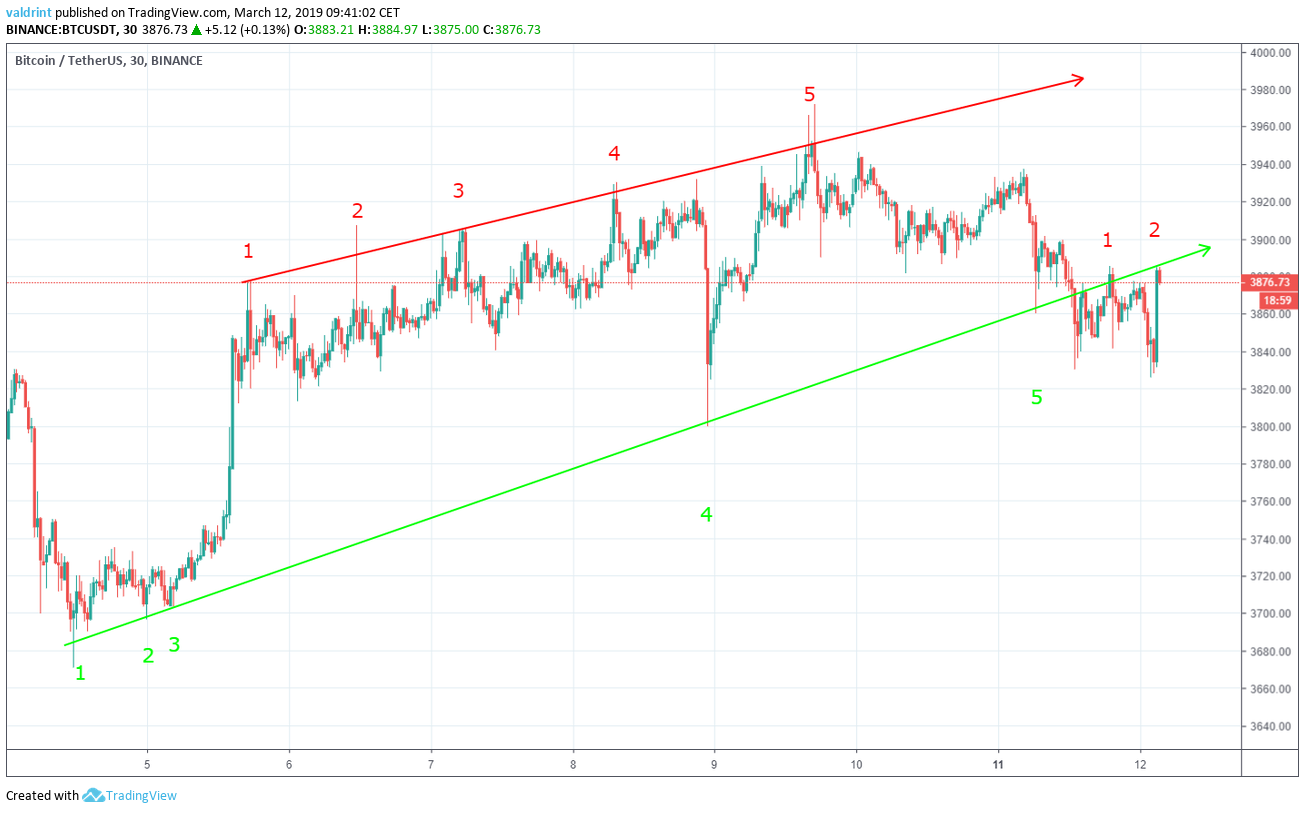
The resistance line can effectively act as a ceiling to price, preventing further upward movement. If the price breaks out of the resistance for a sustained period, rapid prices increases may occur.
The resistance and support lines combine to create an ascending wedge, which is a bearish pattern, making a price decrease more likely than an increase. On Mar 11, such a price decrease occurred.
Since the breakdown occurred, the former resistance line became an inaccurate marker of the upper limits of Bitcoin’s price. Currently, the former support is now acting as temporary resistance. This is likely to change soon.
Estimating the Breakdown
The moving average convergence divergence (MACD) is a trend indicator that shows the relationship between two moving averages (long and short-term) and the price. It is used to measure the strength of a move. The relative strength index (RSI) is an indicator which calculates the size of the changes in price in order to determine oversold or overbought conditions in the market.
Combining MACD and RSI bullish/bearish divergence with support/resistance essentially predicts price fluctuations.
Volume is a measure of how much of a certain asset is traded in a certain period of time. Combined with the MACD and/or RSI, it can be used as a confirmation tool for the beginning of a trend.
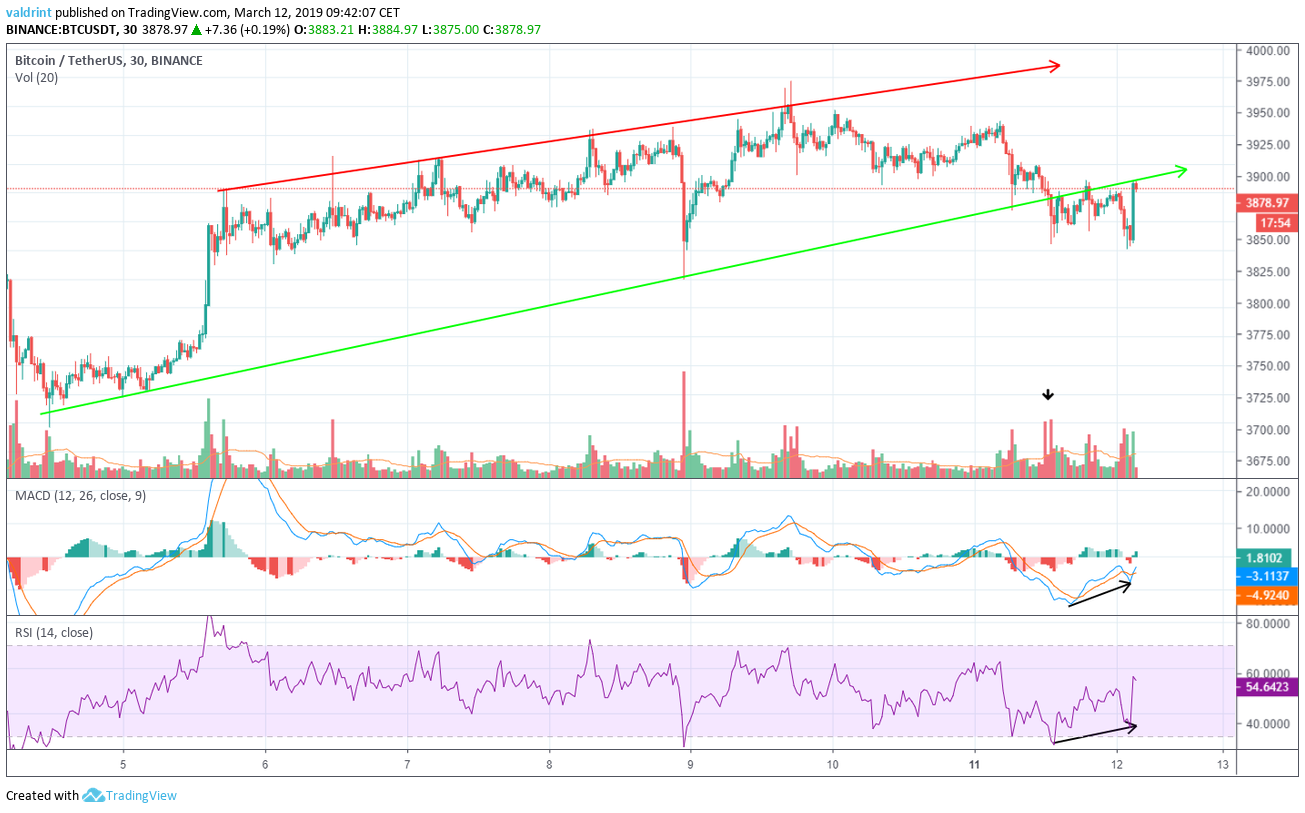
The price broke down from the support line on Mar 11. After making a low of $3830, it continued falling to a lower low of $3826.06 the following day.
Similarly, the MACD and the RSI each made their first low on Mar 11. However, higher lows have since followed. This indicates that bullish divergence has emerged and that future price increases may be soon forthcoming. Such increases might occur as part of a natural market cycle. Full or partial recovery of lost value between Mar 11 and 12 may occur within the short-term.
Furthermore, we can see that the breakdown occurred when the volume of trading was at normal levels. This could mean that the current breakdown is a false breakdown. In such a case, future price increases become more likely.
Using these indicators, it is suggested that Bitcoin’s price is likely to rise in the near future. If such rises occur, new support and resistance lines may develop. The current price drops, however, are likely to continue for a period before a recovery ensues. These drops will probably create new resistance and support.
In short future decreases may continue followed by a recovery with both movements generating new support and resistance lines.
Future Movement
In order to better determine possible future levels of resistance and support, the price of BTC on Binance is analyzed at two-hour intervals from Feb 24 to Mar 11. 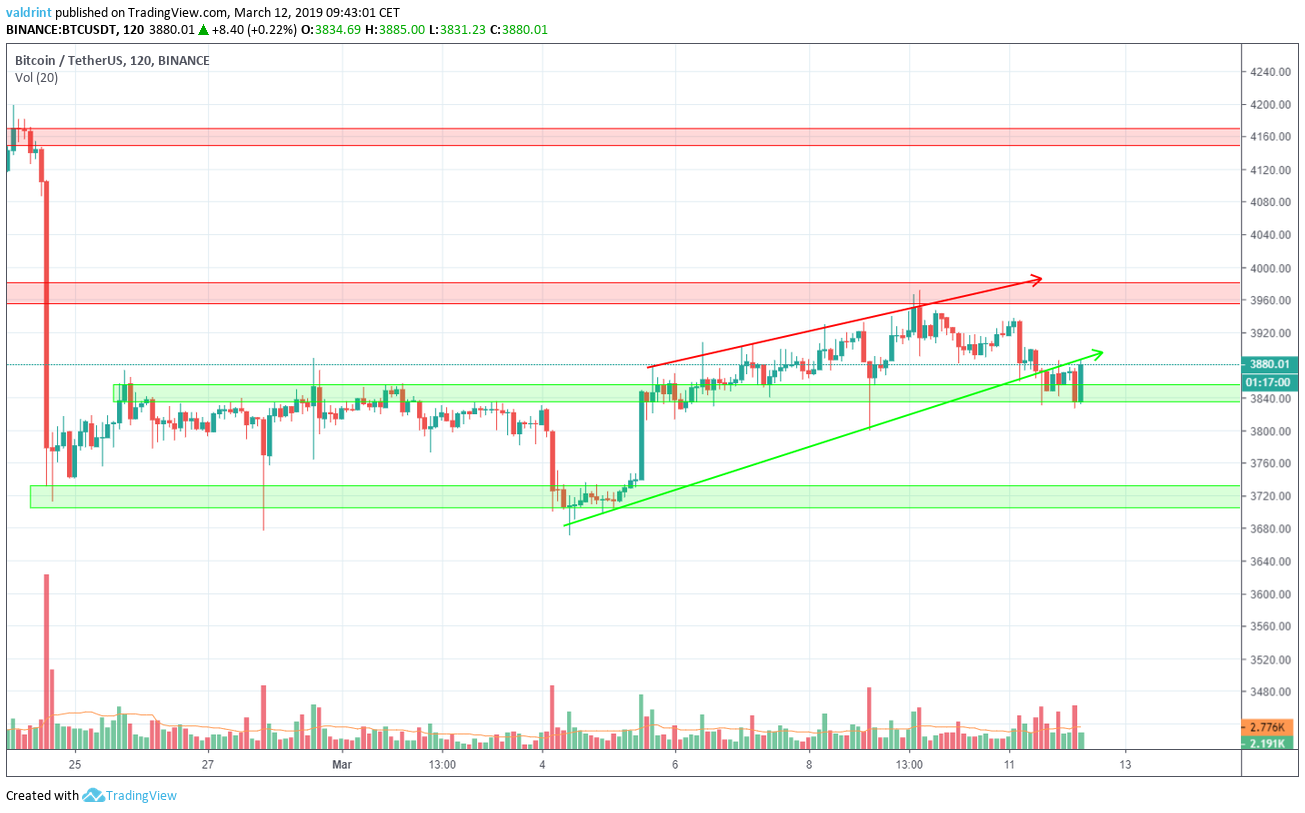
The first support area is found near $3840 and the second near $3720. We can see that after the breakdown price found support inside the first area. If the price decisively drops below $3840, it is possible that it will head for $3720. A breakdown below the second support area could lead to rapid price decreases.
Though the price may not reach these resistance areas, price decreases are considered likely in the future. We are not currently predicting rapid price decreases below $3720.
Conversely, the closest resistance area is found near $3960. The second one is found near $4160. In case of a breakout above the support line turned to resistance, a price of $3960 might be reached. A break above this level could lead to prices as high as $4160. We believe that this scenario is not likely in the near future.
Summary of Analysis
Based on this analysis, new support and resistance lines are likely to develop as the price of BTC continues to drop over the short-term. Following these drops, a recovery is expected which could bring BTC above $4000. Such a recovery would force new support and resistance lines to emerge.
Disclaimer: This article is not trading advice and should not be construed as such. Always consult a trained financial professional before investing in cryptocurrencies, as the market is particularly volatile.