
In this review, we suggest considering the personal composite instrument XAG/EUR – Silver vs Euro. As its name suggests, it reflects the price dynamics of silver vs the European single currency. Will XAG/EUR prices increase?
Their growth indicates an increase in silver prices and a weakening of Euro. Last year, for the first time since 2013, there was an increase in the world demand for silver from industrial enterprises. The main reason for this was the active development of photovoltaic cells and higher demand for solar batteries. The industrial demand for silver increased by 4%. The world silver production in 2017 declined for the second consecutive year and amounted to 852 million ounces. This is 4.1% less than in 2016. Last year, the average price of silver was $17.05 per ounce, which is noticeably lower than the current level. The exchange rate of euro in the last 3 months is in a narrow range: 1.22-1.25. In the EU, moderately positive economic data have been coming out. The exit of the euro from the range is possible on the results of the next ECB meeting, which will be held on April 26, 2018.
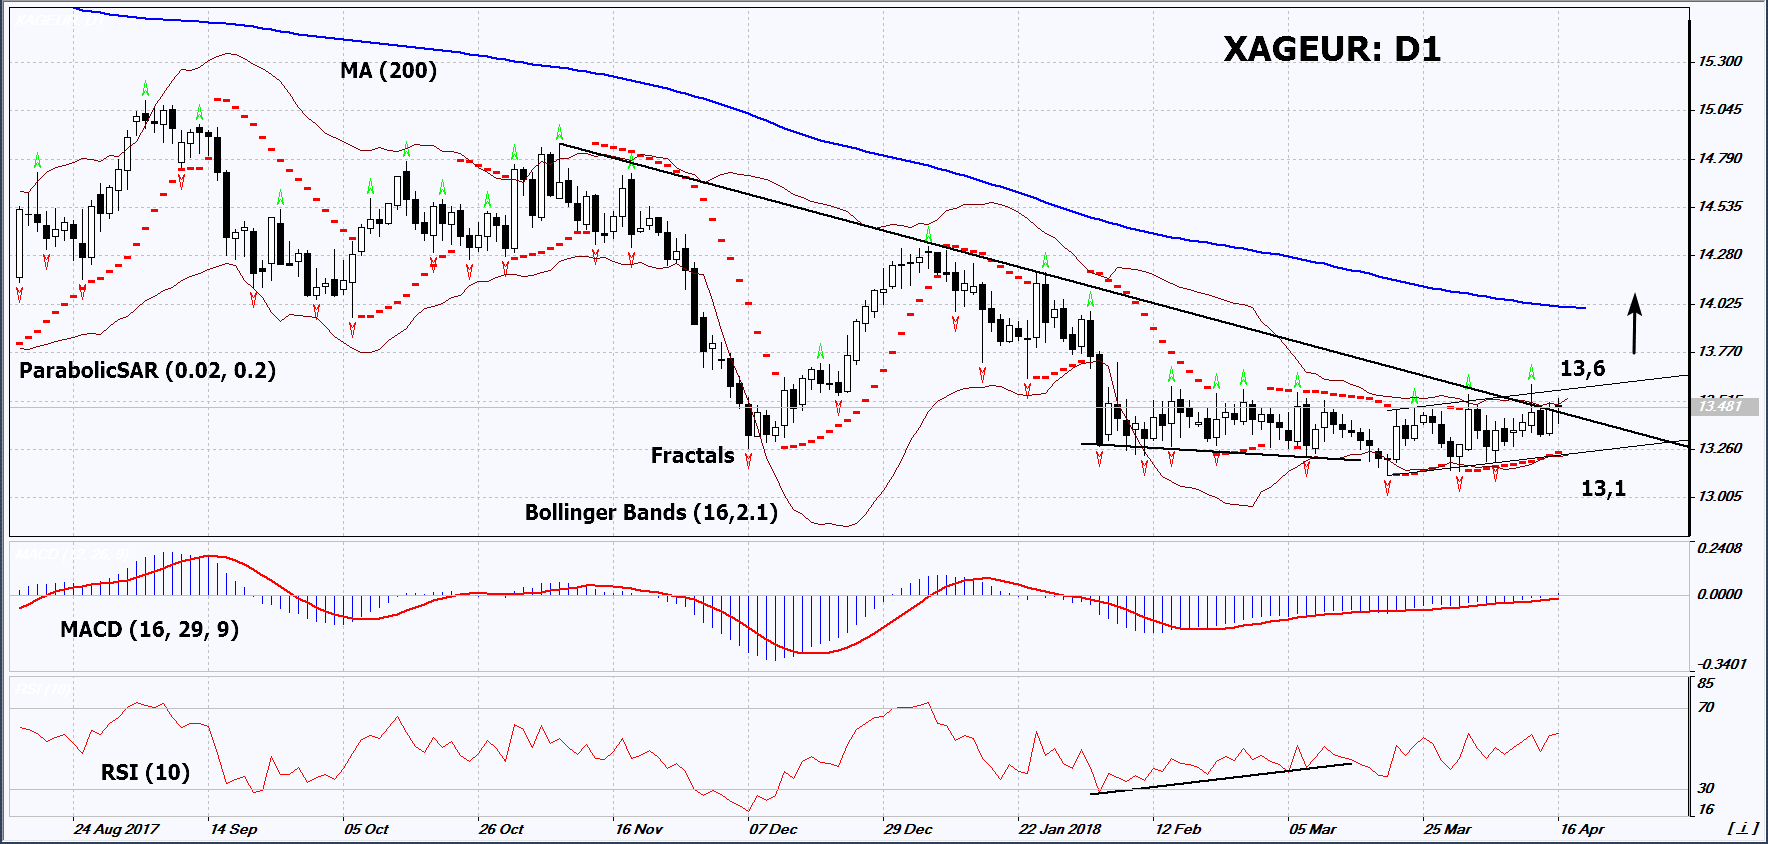
On the daily timeframe, XAG/EUR: D1 is trying to edge up from the downtrend. The further price increase is possible in case of increasing global political risks and an increase in demand for precious metals, as well as in case of the publication of negative economic data in the Eurozone.
- The Parabolic indicator gives a bullish signal.
- The Bollinger bands® have narrowed, which indicates low volatility. They are titled upward.
- The RSI indicator is above 50. It has formed a positive divergence.
- The MACD indicator gives a bullish signal.
The bullish momentum may develop in case XAGEUR exceeds the last fractal high and the upper Bollinger band at 13.6. This level may serve as an entry point. The initial stop loss may be placed below the three last fractal lows, the lower Bollinger band, the 9-month low and the Parabolic signal at 13.1. After opening the pending order, we shall move the stop to the next fractal low following the Bollinger and Parabolic signals. Thus, we are changing the potential profit/loss to the breakeven point. More risk-averse traders may switch to the 4-hour chart after the trade and place there a stop loss moving it in the direction of the trade. If the price meets the stop level at 13.1 without reaching the order at 13.6, we recommend to close the position: the market sustains internal changes that were not taken into account.
Summary of technical analysis
Position Buy
Buy stop Above 13,6
Stop loss Below 13,1